|
|
1000
Asia Pacific J Clin Nutr (1996) 5: 79-83
Asia Pacific J Clin Nutr (1996) 5: 79-83
Body
mass index of the elderly derived from height and from armspan
B Rabe1,2 MSc, MH Thamrin1
MD, R Gross2,3 PhD, NW Solomons4
MD, W Schultink3 PhD
- SEAMEO-TROPMED Regional Center
on Community Nutrition, University of Indonesia, Jakarta
- Institute for Nutritional Sciences,
University of Bonn, Bonn, Germany;
- Deutsche Gesellschaft fÜ r Technische Zusammenarbeit (GTZ) Eschborn,
Germany
- Center for Studies of Sensory Impairment,
Aging and Metabolism (CeSSIAM), Guatemala City, Guatemala
The body mass index (BMI) has been promoted as a
useful indicator for chronic energy deficiency, and to a lesser
extent to indicate obesity. For the growing sector of elderly in
developing countries, such as Indonesia, both issues are taking
on public health relevance. The aging process leads to a progressive
loss of height, and questions have been raised as to the appropriate
value to include in the denominator of the BMI formula, WT(kg)/HT(m2),
when applied in this age-group. The armspan has been advanced as
a surrogate for height, correcting for the lifelong loss of stature.
In a data-set from 69 elderly in Indonesia, 36 women and 33 men,
aged 60 to 69 y, we have examined the interrelationships of height
and armspan. The correlation coefficient for the regression of the
two measures were r = 0.83 and r = 0.81 (p < 0.001), for women
and men, respectively.
Substituting the armspan term in the denominator
to compose a Body Mass using Armspan (BMA) Index, we observe for
this population a 32% increase in estimates for Chronic Energy Deficiency
(CED) for women and 24% increase in estimates of CED for men. Corresponding
estimates for obesity rates declined by 45% and 81% respectively.
The senescent changes in stature raise important questions for our
capacity to estimate prevalences of body composition disorders in
the older population.
Introduction
Poor nutritional status is common among the elderly,
and is associated with increased mortality and morbidity1,2.
Yet, until recently, there has been little research on the nutritional
status of the elderly3. Aging is accompanied by changes
in body composition and stature4. Furthermore, racial differences
have been reported in anthropometric indices5-8, making the analysis
of nutritional status in elderly more complex and discouraging.
Numerous methods are available to assess nutritional
status by way of body composition, also applicable for the elderly9,10.
Body mass index (BMI) has usually been the index of choice in studies,
because its components - height and weight - are rapid and simple
to measure. The robustness of the BMI as an indicator of chronic energy
deficiency (CED) has been vigorously championed8,11,12,
and, to a lesser extent, defended as an index of overweight as well12-14.
Furthermore both extremes of BMI have proven to be strong predictors
of increased mortality and morbidity15-17.
Functional decline is a reality for the elderly18
and the superimposition of age and CED would be expected to compound
an adverse situation. How well, we might ask, does the BMI serve as
a predictor of CED in those of advanced age, and are the cut-off points
proposed in the classification applicable for the elderly? Using height
in calculating BMI could be inappropriate because of height-loss with
aging due to the compression of vertebrae, kyphosis and osteoporosis19-21.
Solomons et al22 have raised the question of an appropriate
weight to cover a frame in which the vertical dimension (height) is
shrinking. Correction of the measured height by an estimate of the
stature that existed in young adulthood was suggested23.
It might be that by using height in calculating BMI the prevalence
of CED in elderly is under-estimated. Armspan is relatively independent
of aging and is highly related to the height of an individual23.
Therefore, to predict the prevalence of CED in elderly it may be more
reliable to use armspan in the determination of weight related to
body stature.
Asian populations are notable for their low BMIs,
putatively reflecting risk of CED24. Thus, the aim of the
present study was to examine the nutritional status of the elderly
by measuring BMI, and then substituting the armspan term for the BMA.
We also examine the level of correspondence between the two measures
(armspan and stature) in Indonesian elderly, providing novel information
on the body composition of the older population in urban Jakarta.
Materials and methods
The study was carried out in the community of Kelurahan
Kemayoran, a low income area in Central Jakarta, Indonesia during
April/May 1993. The elderly were selected by simple random sampling
out of community lists. If somebody had moved away or died, or could
not be located after trying twice, another elderly person of the same
sex and from the same subdistrict of Kelurahan Kemayoran was chosen.
In the collection of the anthropometric data, weight,
height and armspan measurements were taken after standardising of
the examiner. The subjects were measured barefoot with light-weight
clothing. Body weights were recorded with an exactness of 0.1 kg using
SECA digital weighing scale (Hamburg, Germany). To measure height,
the barefoot subjects were requested to stand straight on a horizontal
surface, heels together, the eyes straight forward. The height measuring
equipment consisted of a microtoise fixed to the wall. Armspan was
measured in the same position as the height, but with the extended
arms in a 90° angle to the body, using a flexible tape. It was measured
across the chest from the longest finger of the left hand to the longest
finger of the right hand. Three readings were taken for each measurement
and the median has been taken as the representative value. Two indices
of nutritional status were used: Body Mass Index (BMI), or weight/height2
(kg/m2), and Body Mass Index using armspan (BMA), weight/armspan2
(kg/m2). The classification 1000 of James et al8
was used for identification of CED.
Table 1. Age and selected anthropometric
data of a group of elderly females and males from Jakarta Indonesia
(mean, standard deviation and range).
| |
Females (n=36)
|
Males (n=33)
|
| |
Mean
|
SD
|
Range
|
Mean
|
SD
|
Range
|
| Age |
64.6
|
± 2.9
|
60-69
|
63.6
|
± 2.9
|
60-69
|
| Weight (kg)* |
46.7
|
± 10.2
|
30.2-70.4
|
52.9
|
± 10.5
|
32.1-75.9
|
| Height (cm)** |
146.8
|
± 4.7
|
136.1-154.3
|
157.9
|
± 5.7
|
143.0-166.3
|
| AS (cm)** |
154.0
|
± 6.0
|
141.2-164.0
|
165.7
|
± 6.8
|
152.1-176 8
|
| HT/AS |
0.96
|
± 0.05
|
0 9-1.01
|
0.95
|
± 0.06
|
0.84-1.02
|
| BMI (kg/m2)
|
21.7
|
± 4.7
|
14.3-30.2
|
21.3
|
± 4.2
|
13.8-30.0
|
| BMA (kg/m2)
|
19.7
|
± 4.3
|
13.5-26.8
|
19.3
|
± 3.8
|
11.6-27.7
|
The International Guidelines for Ethical reviews of
Epidemiological Studies25 served as a basis for the ethical
considerations of the implementation of this study. For the statistical
analysis first, the distribution of all variables were tested against
a normal distribution using the Kolomogrov-Smirnov Test to check for
differences at a significance level of p < 0.05. Differences in
mean values between sexes were analysed using Student’s t-test
for independent samples with a confidence interval of 95% (p,<0.05).
Correlation analysis of anthropometric variables was carried out to
calculate the Pearson product - moment correlation coefficient.
| Results
Sixty-nine subjects, 36 women and 33 men aged 60 to 69 y, were
examined. Table 1 lists sex-specific means, standard deviations
and ranges of the age and anthropometric measurements for the
subjects. Women had significa 1000 ntly lower weight, height
and armspan than men (p < 0.05). No significant differences
between sexes were found for the height/armspan-relationship
(HT/AS), the BMI and the BMA.
On average the armspan of the females was 7.3
cm longer than height; that of the males was 7.6 cm longer (Table
2). The range of difference between armspan and height was wide,
from -2.4 cm up to 17.0 cm in both genders. The BMA was, on
average, 2.0 kg/m2 lower than the BMI for both sexes
on average.
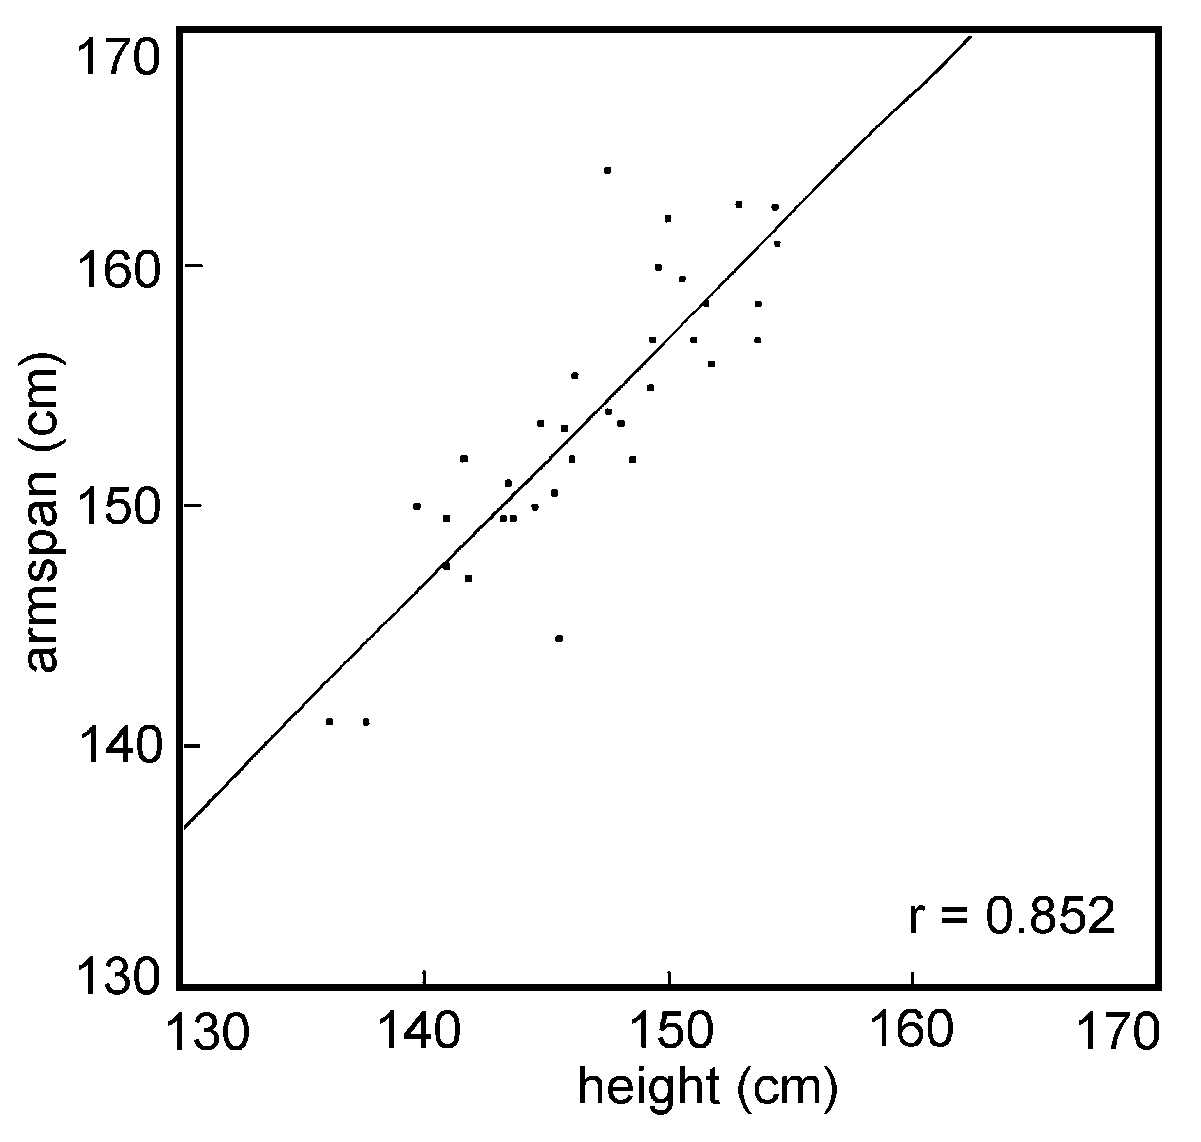
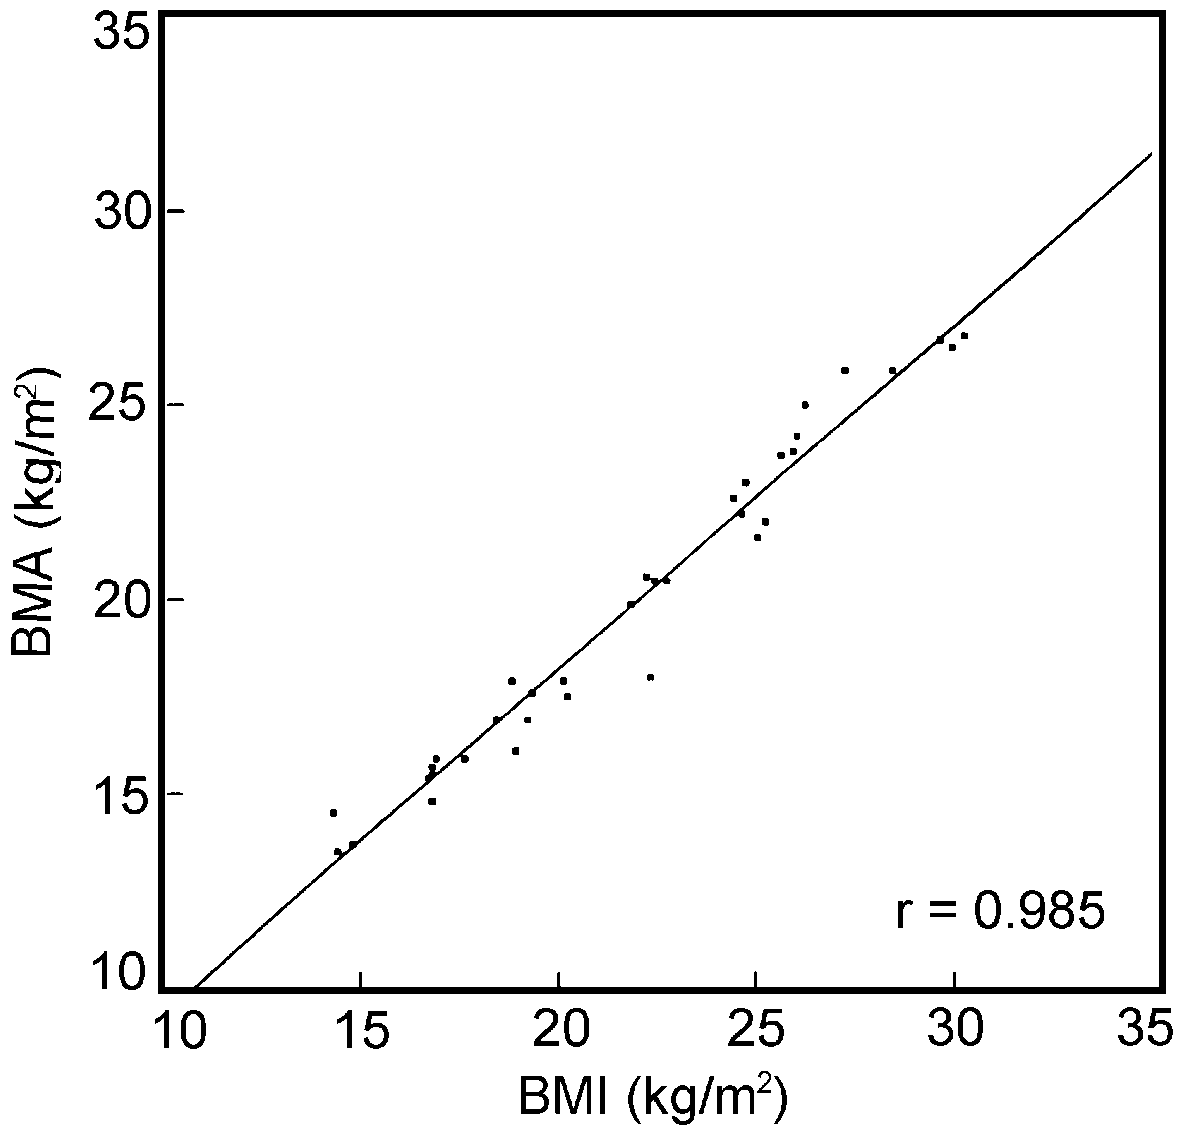
Figures 1 and 2 show the correlation coefficients
of the linear regression between armspan and height, for females
(0.83) and males (0.81), respectively; their significance was
p<0.001. A similar statistical significance was observed
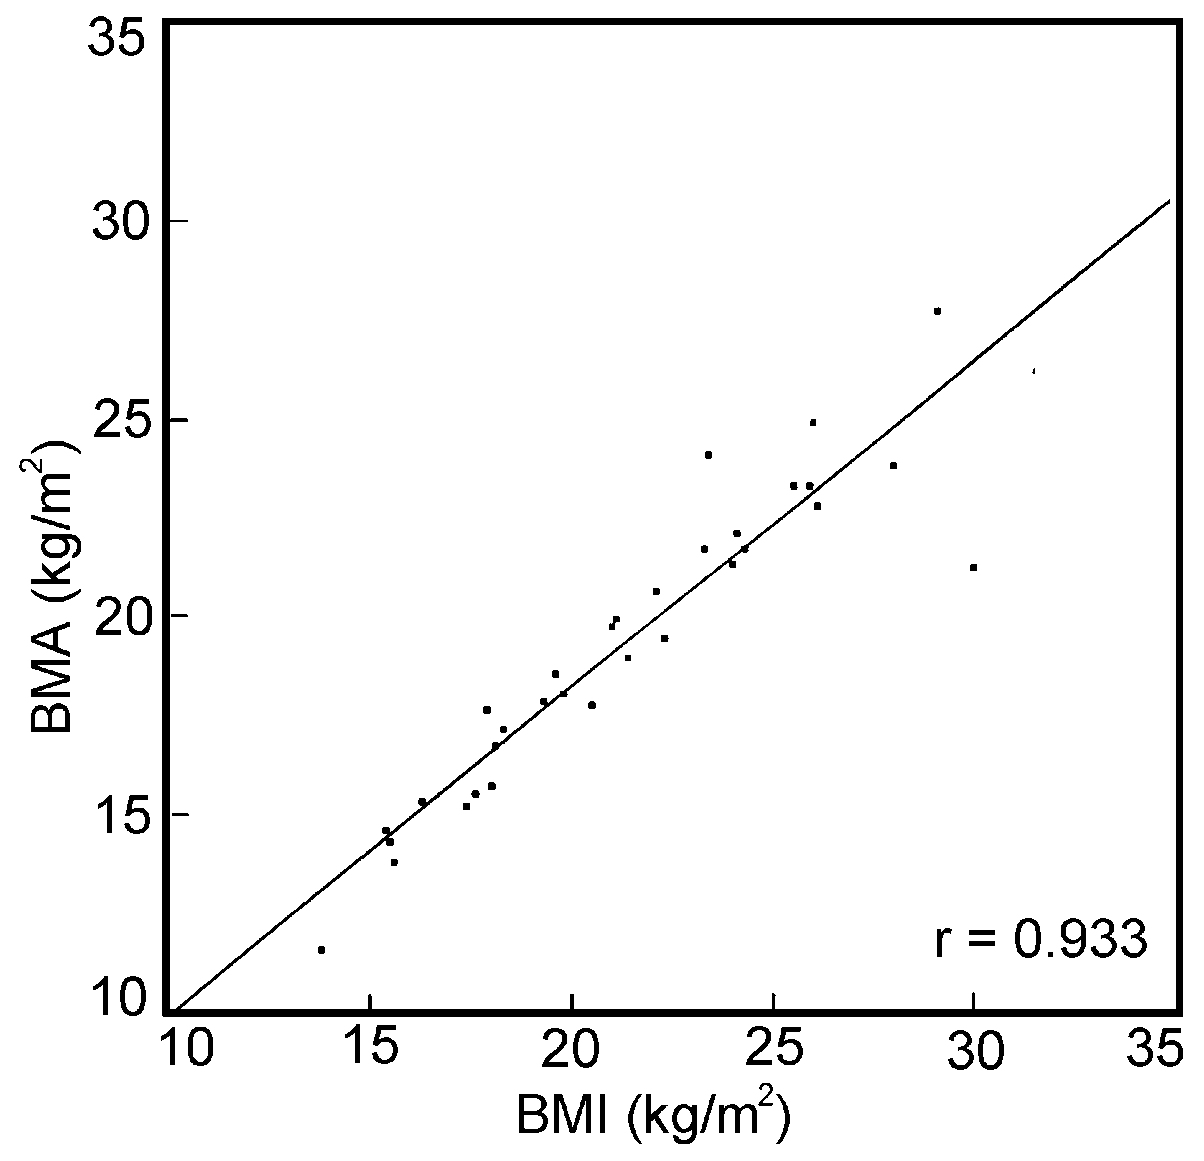
for the relation between the BMI and the BMA; the correlation
coefficients of the latter were 0.98 for women and 0.96 for
men (Figures 3 and 4).
|
Table 2. Difference between
armspan and height and between BMA and BMI in a selected group
of elderly males and females from Jakarta.
| Group |
N
|
Mean
|
SD
|
Range
|
| AS - HT (cm) |
|
|
|
|
| All |
69
|
7.9
|
± 4.0
|
-2.4-17.0
|
| Women |
36
|
7.3
|
± 3.3
|
-0.9-16.7
|
| Men |
33
|
7.6
|
± 3.6
|
-2.4-17.0
|
| BMA - BMI (kg/m2) |
|
|
|
|
| All |
69
|
2.0
|
± 1.0
|
-0.7-6.1
|
| Women |
36
|
2.0
|
± 0.9
|
-0.2-4.3
|
| Men |
33
|
2.0
|
± 1.2
|
-0.7-6.1
|
AS - Armspan; HT - Height; BMI - Body mass index;
BMA - Body mass index calculated by height
|
| Figure 1.
Correlation between height and armspan in a selected group of
elderly females from Jakarta. |
 |
| Figure 2.
Correlation between height and armspan in a selected group of
elderly males from Jakarta. |
 |
| Figure 3.
Correlation between BMI and BMA in a selected group of elderly
females from Jakarta |
 |
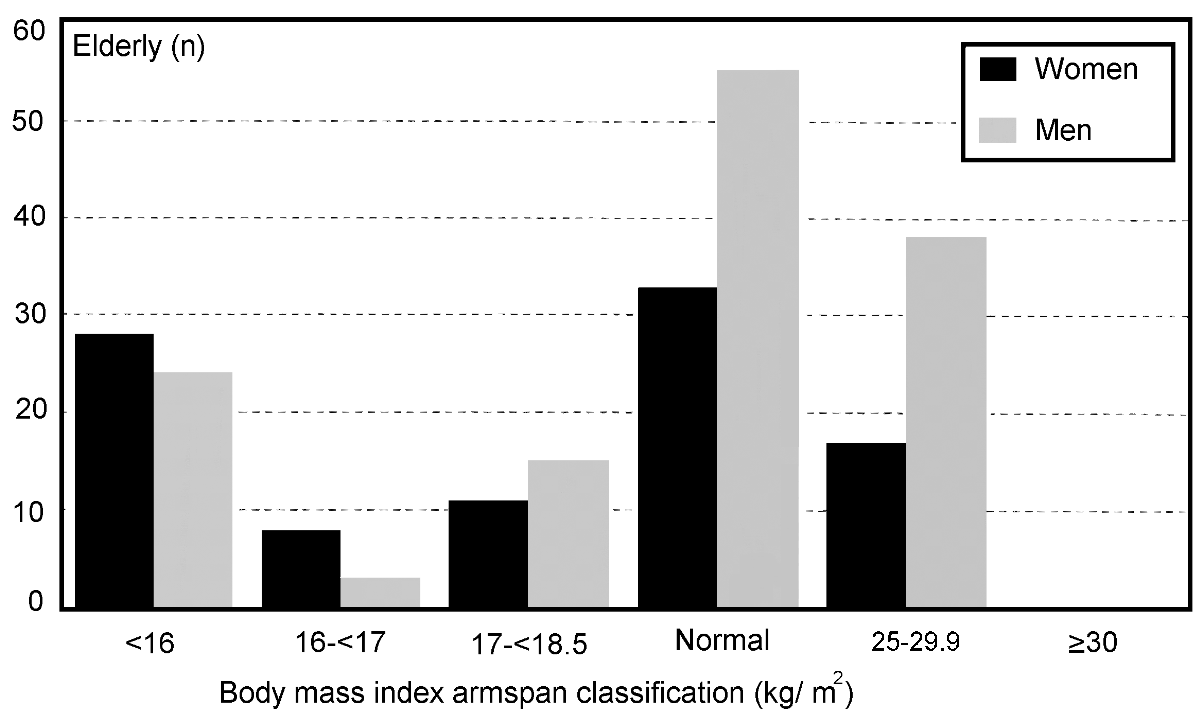
| Figure 4.
Correlation between BMI and BMA in a selected group of elderly
males from Jakarta. |
 |
Figures 5 and 6 show the proportion of the elderly
falling into the different classes of chronic energy deficiency and
obesity, for females and males, respectively. About one-third of the
subjects had a BMI below 18.5 kg/m2. A remarkably high
proportion of the male subjects (12%) had a BMI below 16.0 kg/m2
which is remarkably high, just as the percentage of females (17%)
below the value of 17.0 kg/m2. Thirty-nine percent of the
females and 46% of the males had a nutritional status considered to
be normal. Thirty-one percent of the female subjects and 21% of the
male subjects were obese. Using the armspan instead of the height
calculating the body mass using armspan (BMA), 46% of the elderly
were classified as undernourished. The portion of the elderly with
a BMA of < 16.0 kg/m2 became especially high at 27%.
No elderly were classified as obese using BMA (>= 30).
| Figure 5.
Distribution of body mass index BMI of a selected group of elderly
females and males from Jakarta according to the classification
of James et al8 and Garrow and Websterl4.
|
 |
| Figure 6.
Distribution of body mass index calculated by armspan (BMA) of
a selected group of elderly females and males from Jakarta according
to the classification of James et al8 and Garrow and
Webster14. |
 |
Discussion
Indonesian elderly in this sample are dramatically
smaller and lighter than their American counterparts26.
The difference in mean height between Indonesian and American subjects
was 20 kg for both sexes. Furthermore the mean values of BMI in this
study were found to be lower than those of developed countries. The
EC/EURONUT SENECA Study, which assessed representative samples aged
75 to 81 in 12 European countries27, found a range in mean
values of BMI from 23.9 to 30.5 kg/m2 for women, and from
24.4 to 30.3 kg/m2 for men. Our mean BMIs of 21.7 kg/m2
for females and 21.3 kg/m2 for males, were below
the lowest mean BMIs of any European subsample. These findings support
those of other studies, which found that small stature as well as
low body weight, seems to be more common in developing countries than
in developed countries5,12. Reasons for differences have
been suggested to have genetic or environmental bases5,28-30.
Furthermore, racial differences in the relationship between body composition
and BMI have been reported6-8. Because BMI reflects body
fat mass as well as lean body mass, the same BMI can represent a completely
different body composition in different races. Therefore, comparison
between different populations have to be viewed cautiously.
James et al8 proposed a classification
with three cut-off points for Chronic Energy Deficiency (CED). Low
values of BMI reflect low 1000 fat and lean-body masses, a state of
greater concern than low fat mass alone, and are perhaps more typical
of Chronic Energy Deficiency than low fat mass alone5.
Values below 18.5 kg/m2 were in general considered as incompatible
with normal good health6,8; values below 17.0 kg/m2
were found to be related to evidence of poor productivity, and increased
morbidity and mortality. With values below 16.0 kg/m2,
the mortality risk increased progressively. This is of great concern
because values outside the range considered as normal have been shown
to be incompatible with health. Grade III of CED, (10% of the subjects)
showed a tripling of mortality rates compared to the normal range
- a situation demanding special attention. Grade II of CED has been
related to an increasing evidence of poor productivity, and increased
morbidity and mortality8. The finding that 31% of female
subjects and 21% of the males were classified as obese is also of
concern because obesity classified by BMI has been established as
a risk factor of morbidity and mortality16,31,32. These
results have to be judged carefully. Although the classification of
James et al8 was based on findings of developing countries,
the anthropometric data were derived from adults aged 20 to 45 y.
However, mean values of BMI have been reported to decrease with aging6
and it is clear that values in the elderly Indonesians are low (although
we do not have a young adult population from Jakarta which with to
assess age-related trends).
On the other side of the BMI equation, cut-off points
for obesity correspond in their classification to the grades of obesity
of Garrow and Webster14: 25.0 to 29.9 kg/m2
(Grade I - as overweight); 30.0 to 39.9 kg/m2 (Grade II
- as obese); and ³ 40.0 kg/m2 (Grade III
- or morbid obesity). As shown in Figures 5 and 6, in the upper panels,
a parallel percentage of women, 32 and 31%, respectively, had some
degree of CED or obesity, with none of the latter in the Grade III
extreme. For men, the rates of all classes of obesity, at 21% was
only two-thirds of their respective rate of underweight.
The high correlation between height and armspan of
0.83 for females and 0.81 for males, found in this sample of Indonesian
elderly, confirmed that armspan approximates the same rank-ordering
of a population as height. Although aging could have produced differential
effects on stature in different people, some greater disordering of
the relationship between the two measures might have developed. In
a cross-sectional study such as this (and without a representative
young-adult control population), however, it could not be determined
how much these relationships were the original ones of youth or the
weaker relationship in the aged due to irregular height decrease.
Height/armspan ratio racial differences have been reported, too33,
but the population of this section of Jakarta were largely Javanese.
According to the classification system of James et
al8, about one-third of the examined female and male subjects
had CED whereas a little less than one-third of the elderly were obese.
A comparison of the upper and lower panels in the Figures 5 and 6,
reveals visually the effect of substituting armspan in the denominator
of the body mass index formula. The total percentage of the female
population in some stage of chronic energy deficiency would rise from
32 to 47% if armspan is, indeed, a more valid representation of the
biologically relevant length of an older, shortened individual. Estimates
of obesity of any grade, on the other hand falls from 31 to 17% in
this gender. For men, the proxy use of armspan raises the overall
apparent CED prevalence from 33 to 42%, while lowering that of o 1000
besity from 21 to 3%.
If we were concerned about a high degree of CED in
this aging urban Indonesian population based on the BMI pattern based
on height, while also worrying about abnormal overweight, as well,
the substitution of the armspan in the denominator should tranquillise
us with respect to the latter and truly alarm us with regard to the
former. Recent unpublished work in Guatemala34, that at
least for that Central American population, the height/armspan index
in young adulthood is not 1.00. It is slightly less in women and substantially
less in men. Thus, the BMA would cause an overcorrection to the left
of the BMI distribution. Given the ethnic differences in the relationship
of height to armspan, the reference height/armspan ratio of youth
should be established for each geographic region of interest.
In conclusion, extended longevity make the nutrition
of the elderly, and residents in urban areas allows for a two-way
concern for nutritional imbalance: under- and over-nutrition. Conceptual
advances for the use of a the simplest of all body compositions indices,
the body mass index, have been offered12, but their applicability
in the elderly must be tested. We have confirmed here in a group of
older residents of slum area in Jakarta the previously reported close
correlation of the armspan and the height. It is still conjectural
whether the armspan is a more valid indicator of the appropriate length
of an older person who might have suffered senescent and pathological
shortening of stature by the seventh decade22. Our study
illustrates the magnitude of the deviation in the distribution that
would occur if the armspan is indeed a better term. Furthermore, more
research is needed on the functional consequences of low BMI and BMA
in elderly.
Chinese
abstract
Indonesian
abstract
References
- Bastow MD, Rawling J, Allison SP. Undernutrition,
hypothermia and injury in elderly women with fractured femur: an
injury response to altered metabolism. Lancet 1983; i: 143-146.
- Bowman BB, Rosenberg IH. Assessment of the nutritional
status of the elderly. Am J Clin Nutr 1982; 35: 1142-1151.
- Kucmarski RJ. Need for body composition information
in elderly subjects. Am J Clin Nutr 1989; 50:1150-1157.
- Stoudt HW. The anthropometry of the elderly. Hum
Factos 1981; 23: 29-36.
- Norgan NG. Body mass index and body energy stores
in developing countries. Eur J Clin Nutr 1990; 44:79-84.
- Strickland SS, Ulijaszek SJ. Body mass index ageing
and different reported morbidity in rural Sarawak. Eur J Clin Nutr
1993; 47:9-19.
- Wang J, Thornton JC, Russell M, Burastero S, Heymsfield
S, Pierson RN Jr. Asians have lower body mass index (BMI) but higher
percent body fat than do whites: comparison of anthropometric measurements.
Am J Clin Nutr 1994; 60:23-28.
- James WPT, Ferro-Luzzi A, Waterlow JC. Definition
of chronic energy deficiency in adults; report of a working paper
of the International Dietary Energy Consultative Group. Eur J Clin
Nutr 1988; 42:969-981.
- Lukaski HC. Methods for the assessment of human
body composition: traditional and new. Am J Clin Nutr 1987; 46:537-556.
- Deurenberg P. Assessm 1000 ent of body composition:
Uses and misuses. Annual Report 1992. Nestle Foundation for the
study of the Problems of Nutrition in the World. Laussane, Switzerland:
Nestle Foundation 1993; 35-72.
- Ferro-Luzzi A, Sette S, Franklin M. James WPT.
A simplified approach of assessing adult chronic energy deficiency.
Eur J Clin Nutr. 1992; 46: 173-86.
- Shetty P, James WPT. Body mass index: a measure
of chronic energy deficiency in adults. Food and Nutrition Paper
No. 56. Rome: Food and Agriculture Organization, 1994.
- Norgan NG, Ferro-Luzzi A. Weight-height indices
as estimates of fatness in men. Hum Nutr Clin Nutr 1992; 360:363-72.
- Garrow JS, Webster J. Quetelet’s Index (W/H2)
as measure of fatness. Int J Obesity 1985; 9:147-153.
- Harris T, Cook EF, Garrison R Higgins MS, Kannel
W, Goldman L. Body mass index and mortality among nonsmoking older
persons. The Framingham Heart Study. JAMA 1988; 259:1520-524.
- Goldbourt U, Medalie JH. Weight-height indices.
Prev Soc Med 1974; 28:116-26.
- Henry JK. Body mass index and the limits of human
survival. Eur J Clin Nutr 1990; 44:329-335.
- Rowe JW, Kahn RL. Human aging: Usual and successful.
Science 1987; 237:143-149.
- Dequeker JV, Baeyens JP, Claessens J. The significance
of stature as a clinical measurement of ageing. J Am Gerontol Soc
1969; 17:169-179.
- Mitchell CO, Lipschitz DA. Detection of protein-calorie
malnutrition in the elderly. Am J Clin Nutr 1982; 35:398-406.
- Wahlqvist MI, Flint DM. Assessment of loss of height
in elderly women. Eur J Clin Nutr 1988; 42:679-682.
- Solomons NW, Mazariegos Mt Mendoza I. Uses of anthropometry
in the elderly in the field setting with notes on screening in developing
countries. Asia Pac J Clin Nutr 1993; 2:15-23.
- McPherson R, Lancaster DR, Carrole JC. Stature
changes with aging in Black Americans. J Gerontol 1978; 33:20-25.
- Baqui AH, Arifeen SE, Amin S, Black RE. Levels
and correlates of maternal nutritional status in urban Bangladesh.
Eur J Clin Nutr 1994; 48:349-357.
- Council for International Organizations of Medical
Sciences. International guidelines for ethical review of epidemiological
studies. CIOMS, Geneva, 1991.
- Chumlea W, Guo S. Equations for predicting stature
in white and black elderly individuals. J Gerontol 1992; 47:M197-M203.
- de Groot PCPGM, van Staveren WA, Hautvast JGAJ.
Euronut SENECA. Nutrition and the elderly in Europe. Eur J Clin
Nutr 1991; 45 (suppl 3); 1-196.
- Durnin JVGA. Anthropometric methods of assessing
nutritional status. In: Horwitz A. ed Nutrition in the elderly.
Oxford : Oxford University Press 1989: 15-32.
- Forbes GB. Body composition: influence of nutrition,
disease, growth, and aging. In: Shils ME, Young VR, eds. Modern
Nutrition in Health and Disease. Philadelphia: Lea & Febiger
1988: 533-556.
- Himes JH, Mueller WH. Age-associated statural loss
and socio-economic status. J Am Geriatrics Soc 1977; 25:171-174.
- Gordon T, Kannel WB. The effects of 6ff overweight
of on cardiovascular diseases. Geriatrics 1937; 28:80-85.
- Stevens J, Keil JE, Rust PF, Verdugo RR, Davis
CE, Tyroler HA, Graves PC. Body mass index and body girths as predictors
of mortality in Black and White men. Am J Epidem 1992; 135:1137-1146.
- Steele MF, Mattox JW. Short Report: Correlation
of arm-span and height in young women of two races. Ann Hum Biol
1987; 14:445-447.
- Sengel JS, Schlimbach A, Solomons NW. unpublished;
1993.
Copyright © 1996 [Asia Pacific Journal of Clinical Nutrition]. All
rights reserved.
Revised:
January 19, 1999
.
0
|