1000
Asia Pacific J Clin Nutr (1997) 6(4): 291-295
Asia Pacific J Clin
Nutr (1997) 6(4): 291-295

Factors
affecting iron status in 15-30 year old female students
AM Rangan1 Bsc, GradDipNutrDiet, I Aitkin2
PhD, GD Blight2 BMedSc, MBBS, PhD, CW Binns2
MBBS, MPH, FRACGP, FACOM, FAFPHM
1 NSW Breast Cancer
Institute, Westmead, NSW, Australia
2 School of Public Health, Curtin University
of Technology, Perth, WA, Australia
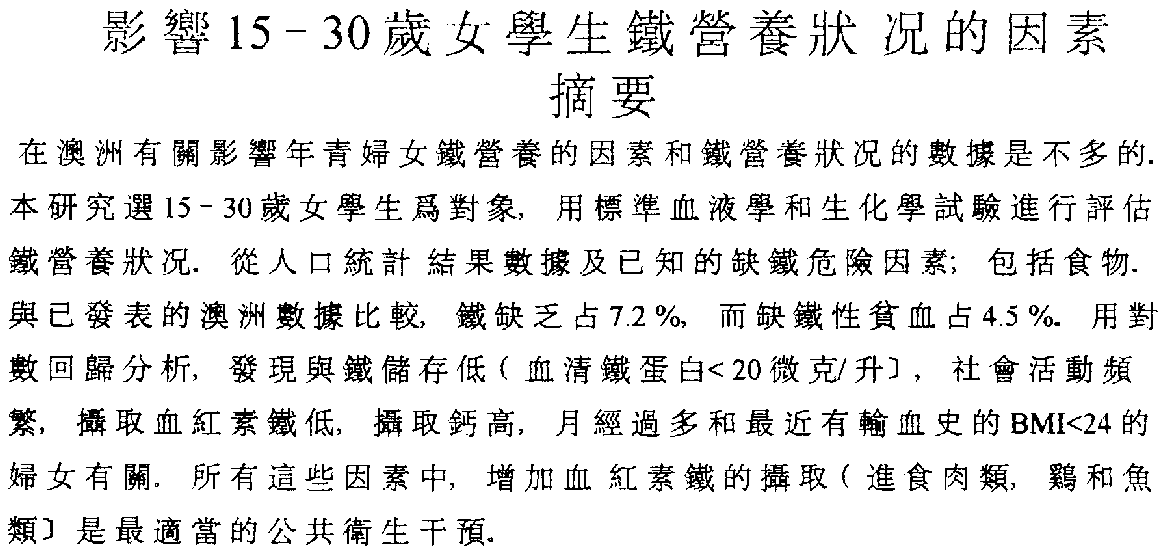
Limited Australian data are available on iron status
and factors affecting iron status in young women. Iron status was
assessed in a population of 15-30 year old students using standard
haematological and biochemical tests. Data were collected on demographic
details and known risk factors for iron deficiency, including diet.
Iron deficiency was present in 7.2% and iron deficiency anaemia
in 4.5% of this population, comparable to previously published Australian
data. Using logistic regression, the factors found to be associated
with low iron stores (serum ferritin <20 m g/L) included high social status,
low haem iron intake, high calcium intake, a high menstrual score
and a recent history of blood donation in women with BMI<24.
Of these factors, increasing haem iron consumption (meat, chicken
and fish) is the most appropriate and easily modifiable factor for
public health intervention in this age group.
Key words: iron, haemoglobin, anaemia,
women, Australia, food intake, vegetarian, vitamin C density, calcium
intake, social status, menstrual function, blood donation, BMI (body
mass index)
Introduction
Iron deficiency is reported to be the most common
nutritional deficiency in the world1. Australian surveys
suggest that those at greatest risk of iron deficiency are adolescent
girls2, pregnant women3, female blood donors3
and vegetarians4, with prevalence estimates of 9-10% in
these groups. The prevalence of iron deficiency is not well defined
in 15-30 year old women even though, due to increased iron requirements
and a compromised intake, this is one of the most vulnerable sub-groups
at risk.
Iron requirements are increased in adolescent girls
with growth and the onset of menarche and remain high in women until
menopause. Iron intake, on the other hand, is often compromised due
to altered eating habits which may occur as a result of voluntary
restriction of food intake, a change in living conditions, poor nutrition
or cooking knowledge. National surveys report that 13-40% of Australian
women fail to meet 70% of the recommended dietary intake (RDI) for
iron5 (the lower limit of the RDI for iron is 10 mg for
15-18 year old females and 12 mg for 1000 19-30 year old females6).
Haem iron intake may be compromised as a result of decreasing red
meat consumption and an increasing trend towards vegetarianism. Other
dietary factors, such as vitamin C and calcium are also known to affect
iron absorption7.
Apart from diet and a history of blood donation, there
are several additional factors which may influence iron status in
young women; use of the oral contraceptive pill (OCP) and intrauterine
devices (IUD), strenuous exercise, and heavy alcohol intake5,8.
The objectives of this study were to determine the iron status of
15-30 year old female students and to identify factors associated
with iron deficiency in this population.
Methodology
Subjects
A total of 265 female students, aged 15-30 years,
participated in this cross-sectional study. Student volunteers were
recruited from the campus of Curtin University of Technology, Perth,
Australia (n=224) and from secondary schools in the Perth area (n=41).
The study was approved by the Human Ethics Committee of Curtin University
of Technology. Subjects were excluded from the study if they were
pregnant, post-partum, lactating or had resided in Australia for less
than one year. Height was measured without shoes to the nearest 0.5
cm. Weight, in light clothing, was measured to the nearest 0.5 kg.
Body mass index (BMI) was calculated as weight (kg) divided by the
square of height (m2).
Students entering the study were asked to complete
a questionnaire which provided details of age, social status, medical
history and factors which could affect iron status, such as dietary
habits and supplement use, oral contraceptive use, frequency and duration
of menstruation, number of parturitions, blood donation, and exercise
patterns. Social status was assessed using Daniel’s scale, based
on the prestige of the father’s occupation9. A menstrual
score combining frequency and duration of menstruation was constructed,
with three categories based on number of menstrual days per year:
low (< 52), medium (52-65) and high (>65). An exercise level
of low, medium or high, as described in the National Health Survey
was ascribed to each student who reported undertaking some exercise10.
A quantitative food frequency questionnaire (FFQ)
was administered consisting of 270 food and drink items11
and was validated for this study population, using 7-day weighed food
records. The FFQs were analysed using the NUTTAB91 database. Haem
iron intake was calculated manually for each subject, using haem iron
contents of Australian meats12. All under-reporters, based
on Goldberg's criteria, and over-reporters (>15 000 kJ) were excluded
from further analyses13.
Laboratory
analysis
A non-fasting venous blood sample was taken to measure
standard haematological [haemoglobin (Hb), mean cell volume (MCV),
and erythrocyte sedimentation rate (ESR)] and biochemical parameters
of iron status [serum iron (SI), serum transferrin (Tn), transferrin
saturation (TS) and serum ferritin (SF)]. A Coulter Counter (Model
STKS) was used to determine the haematological parameters. Serum iron
was assayed colourimetrically using the guanidine/ferrozine method
and was performed without deproteinisation14. Serum ferritin
was assayed by immunoturbidometry using latex particles coated with
antibodies to ferritin (Tina-quant®, Boehringer Mannheim).
Transferrin was assayed by immuno-turbidometry using goat anti-human-transferrin/
TRIS/ poly-ethylene glycol (Tina-quant®, Boehringer Man
1000 nheim). Transferrin saturation was calculated using the formula:
serum iron/ (transferrin x 20) x 100.
Data
analysis
Prior to statistical analyses, skewed distributions
were log-transformed (serum ferritin). A retransformation back to
original units was made before reporting the results. The 95% confidence
interval of the mean (95% CI) and percentile ranges are reported for
iron status parameters. Logistic regression was used to determine
the factors predictive of low iron stores (serum ferritin <20 m g/L15) and to estimate the magnitude
of the association between predictor variables and outcome by obtaining
odds ratios. The nutrient variables were entered into the model as
nutrient densities, together with energy intake. This model, termed
the multivariate nutrient density model, has been described by Willet16.
It controls for confounding by energy intake, allowing the coefficient
for the nutrient density variable to represent the relation of the
nutrient composition of the diet while holding total energy intake
constant. All statistical analyses were computed using SPSS-Windows,
Version 6.1, Chicago 1995.
Results
Descriptive
data
The age range of the students was 15-30 years with
a mean of 20.7 years (SD 3.5 years). Most students (55%) were classified
in the healthy weight range (BMI 20.0-25.0), 32% were underweight
(BMI < 20.0) and 13% were overweight (BMI > 25.0). These percentages
are comparable to Australian data10. The mean prestige
ranking was 3.9 (SD 1.1) using Daniel’s scale, corresponding
to semi-professional and middle-management groups.
The FFQ was satisfactorily completed by 167 subjects
after excluding under- and over-reporters. The median daily nutrient
intakes were; energy 7700 kJ, 16.1% energy from (% E) protein, 52.2%
E carbohydrate, 30.2% E fat, 1.9% E alcohol, 24.4 g fibre, 11.7 mg
iron, 1.93 iron from meat, fish and poultry (MFP-iron), 1.07 mg haem
iron, 830 mg calcium, 156 mg vitamin C. Nearly 25% of subjects reported
never drinking alcohol. The median daily alcohol intake was 4.8g per
consumer, with 4% of students consuming in excess of 20g alcohol daily.
A large proportion of subjects classified themselves
as vegetarian (13%) or semi-vegetarian (17%), and consumed minimal
amounts of red meat. The use of vitamin and mineral supplements was
common, with 41% of subjects taking supplements on a regular basis.
Thirty-five percent of subjects were currently using the OCP and none
reported the use of an IUD. Most subjects had regular cycles (73%)
and menstruated 4-5 days per cycle (60%). Using menstrual scores,
the following percentages were obtained; 17% for low score, 48% for
medium and 35% for high score. Thirteen percent of subjects had donated
blood at least once in the past six months. The majority of students
(66%) reported no or low levels of exercise and only 10% reported
high levels of exercise, based on frequency, duration and intensity
of activities undertaken.
Iron
status
The mean values, 95% CI of the mean and percentiles
for the iron status parameters measured are presented in Table 1.
Various methods for estimating the prevalence of iron deficiency (ID)
and iron deficiency anaemia (IDA) are compared in Table 2. Using multiple
criteria, iron deficiency was present in 7.2% of the student sample
and iron deficiency anaemia in 4.5%. A large percentage of students
were anaemic (10.2%) although there was no other apparent ca 1000
use of the anaemia in subjects who were not iron deficient. The prevalence
of low iron stores (SF<20 m g/L) was 19.8%.
Table 1. Haematological and biochemical indicators
of iron status in female students in Perth, aged 15-30 (n=265).
| Parameter |
|
Percentile
|
| (reference range) |
Mean
|
95% CI
|
2.5
|
10
|
50
|
90
|
97.5
|
| Hb (12.0-16.0 g/dL) |
13.2
|
13.0-13.3
|
11.1
|
11.9
|
13.2
|
14.1
|
14.7
|
| MCV (80-100 fL) |
86
|
85.3-86.3
|
75
|
81
|
86
|
90
|
93
|
| MCHC (31-36%) |
34.4
|
34.3-34.5
|
33
|
33
|
34
|
1000
35
|
36
|
| SI (7-24 m mol/L) |
16
|
15.1-16.7
|
4
|
8
|
16
|
25
|
31
|
| Tn (2.0-4.0 g/L) |
3.2
|
3.14-3.26
|
2.4
|
2.6
|
3.1
|
3.9
|
4.1
|
| TS (16-40%) |
26
|
24.2-27.1
|
6
|
11
|
24
|
42
|
51
|
| SF * (20-200 m g/L) |
28
|
25.1-30.4
|
4
|
12
|
29
|
68
|
101
|
* geometric mean for SF (serum ferritin)
Table 2. Prevalence of iron deficiency in 15-30
year old female students in Perth measured by various criteria (n=265).
1000
| Criteria |
%
|
(n)
|
| Iron deficiency Anaemia |
|
|
| Single criterion (Hb<12.0) |
10.2
|
(27)
|
| Multiple criteria (Hb<12.0,
SF<12, TS<16) |
4.5
|
(12)
|
| Iron deficiency |
|
|
| Single criterion |
|
|
| SF<12 |
12.5
|
(33)
|
| SF<16 * |
19.8
|
(51)
|
| TS<16 |
19.8
|
(52)
|
| Multiple criteria (SF<12,
TS<16) |
7.2
|
(19)
|
* criterion according to Hallberg et al 17
Multivariate
analysis
Multivariate analysis was undertaken to examine the
factors independently associated with iron status in this population.
The predictor variables entered in the logistic regression model were:
age, BMI, social status, recent blood donation, menstrual score, OCP
use, vitamin/mineral supplement use, alcohol intake, exercise levels,
energy intake (kJ), protein (% E), total iron density, haem iron density,
calcium density and vitamin C density. The outcome variable was low
iron stores (SF<20 m g/L). Table 3 presents the results of the most parsimonious logistic
regression model with significant predictors of low iron stores being
social statu 1000 s (high), haem iron density (low), calcium density
(high), recent blood donation (yes), BMI (low) and menstrual score
(high).
Table 3. Factors associated with low iron stores
in students aged 15-30 year old
| Variable |
Coef-ficient
|
Std Error
|
OR
|
95% C.I.
|
| Social status (per unit
change) |
-0.59
|
0.21
|
0.56
|
0.37-0.85
|
| Calcium density (per
100mg/1 MJ change) |
1.13
|
0.53
|
3.10
|
1.10-8.75
|
| Haem iron density (per
0.1 mg/1 MJ change) |
-0.45
|
0.23
|
0.64
|
0.41-1.00
|
| Donation (compared to
no donation) |
19.06
|
8.20
|
-
|
-
|
| Donation x BMI |
-0.79
|
0.37
|
-
|
-
|
| Menstrual score (compared
to low/medium) |
|
|
< 1000 /td>
| |
| high |
1.0177
|
0.4588
|
2.77
|
1.13-6.80
|
Logistic regression analysis: deviance=150.8, df=160,
n=167
A higher social status was associated with greater
chances of low iron stores. Haem iron density was protective of iron
stores. A diet containing 0.1 mg haem iron/MJ (the equivalent of 0.8
mg of haem iron in a 8000 kJ ‘Western diet’) decreases the
odds of low stores by 35% compared to a vegetarian diet which contains
no haem iron. A diet containing 1.6 mg of haem iron (approximately
100g lean beef) and 8000 kJ, would reduce the odds of low iron stores
by 60%. Dietary calcium density is a positive predictor of iron deficiency
in this model, with the odds of low iron stores being increased three-fold,
with an increase in calcium density of 100 mg calcium/MJ. In practical
terms, this is the equivalent of a change in calcium intake from 400
mg to 1200 mg, assuming a constant energy intake of 8000 kJ per day.
An interactive effect was observed between recent
blood donation and BMI. A BMI greater than 24 was found to be protective
against low iron stores for blood donors only, while a BMI below 24
increased the risk of low iron stores in blood donors. BMI was not
associated with iron stores in non-donors. A high menstrual score
(menstruating for more than 65 days per year) was associated with
an increase in the odds of low iron stores of over 2.5 times compared
with women who menstruated fewer days per year.
Factors which were not found to be associated with
iron deficiency in this study included age, vitamin and mineral supplement
use, oral contraceptive use, alcohol intake, exercise levels, energy
intake, protein intake, total iron intake and vitamin C intake.
Discussion
The results of this study report the iron status and
the factors predictive of low iron stores in a group of 15-30 year
old female students in Perth. Anthropometric data were com-parable
to Australian data of similar populations10. The social
status of the sample is relatively high when compared to the general
population due to the large number of university students in the sample18.
The prevalence of iron deficiency (TS<16 and SF<12)
in this sample of female students was 7.2%, and iron deficiency anaemia
(Hb<12, TS<16 and SF<12) was present in 4.5% of students.
These results are comparable to Australian studies of iron status
in women (Table 4). The prevalence of iron deficiency is lower in
the present study (7.2%) compared to 15 year old schoolgirls (9.2%)2
but higher when compared to 20-69 year old women (4%)3.
Table 4. Iron status of Australian women (data
on 15-30 year old where available).
| Reference |
Subjects |
n
|
1000 Criteria used
|
Prevalence (%)
|
Mean levels
|
| NHF, 1989 3 |
20-69 y women
Australia |
4267
|
SF<10
TS<10
ID
|
8
9
4
|
|
| Leggett et al,
1990 8 |
17-65 y female employees
Brisbane |
920
|
SF<10 and TS<20
SF<10
|
5.5
8.9
|
|
| English and Bennett,
1990 2 |
15 y schoolgirls
Australia |
142
|
SF<12 and TS<16
SF<12
TS<16%
|
9.2
20
21
|
SF=31.7
SI=16.9
TS=22.3
|
| This study |
15-30 y students
Perth |
265
|
SF<12 and TS<16
SF<12
SF<10
|
7.2
12.5
8.7%
|
SF=28 *
TS=26
Hb=13.2
|
* geometric mean
Factors
associated with low iron stores
Social status, as assessed by parental occupational
prestige, was found to be inversely related to iron status, after
controlling for other known risk factors. This is in contrast to the
study by Leggett et al 8, who found higher than
average iron stores in populations of high socioeconomic status. Social
status is difficult to measure in university students, as university
life is often a transient stage with many students leaving home for
the first time, and being required to organise their own meals and
becom 1000 e responsible for their finances. Parental occupational
prestige may thus not be the ideal measure of the social status of
the student, but was chosen due to the lack of alternative measures.
A possible reason for an adverse association between social status
and serum ferritin concentration may be a greater pre-occupation with
body weight and image in young women from high prestige family backgrounds
and/or who are high achievers19.
The number of studies showing significant associations
between diet and iron status is relatively small. This is probably
due to the difficulties of evaluating dietary intake over an appropriate
period of time as iron status is the balance between iron absorption
and loss, usually over several months. Methods to assess intake over
short periods of time, for example 24-hour recall, do not take into
account the high day-to-day variability of food consumption. The FFQ,
which evaluates dietary intake over a longer period of time, may be
more appropriate for investigating the relationships between diet
and iron status. Indeed, in the present study, two nutrient variables
(haem iron density and calcium density) were found to significantly
affect iron status. No relationship was found with vitamin C intake,
a known enhancer of iron absorption.
Low haem iron densities were found to increase the
chances of becoming iron deficient, after controlling for other co-variables
(social status, calcium intake, BMI, blood donation and menstrual
score). Preziosi et al20 found a similar relationship
between haem iron intake and serum ferritin concentration in a French
population. These results are also in agreement with current literature
which suggests that low intakes of meat and fish are a risk factor
for iron defic-iency4,8,21,22.
No relationship was found between dietary iron intake
and serum ferritin concentration. This suggests that the quality of
iron intake (haem iron versus non-haem iron) is a more important determinant
of iron status than the quantity of iron consumed. Most other studies
have failed to find a significant association between non-haem iron
intake and serum ferritin concentration23-25.
A high calcium intake was associated with an increased
likelihood of becoming iron deficient, after controlling for other
factors. A calcium-rich diet (1200 mg), as recommended by the US Consensus
Statement on Calcium Intake26, increases the odds of low
iron stores three times when com-pared to a calcium-poor isocaloric
diet (400 mg). A relation-ship between calcium intake and iron stores
has been observed previously20, as well as an association
between a high consumption of dairy products and iron deficiency23,27.
Recent data show that calcium inhibits haem and non-haem iron absorption
when consumed simultaneously7.
Blood donation is a well known risk factor for iron
deficiency8,15,28. Fogelholm et al15 showed
that women who had donated blood in the past 6 months were 2.5 times
more likely to have low iron stores. In the present study, recent
blood donation was found to be a significant predictor of low iron
stores, but only in subjects with a BMI<24. For an individual of
small body size, the donation of a unit of blood (240 mg iron) represents
a larger proportion of total body iron which may lead more rapidly
to smaller body iron stores. Further evidence of this has been provided
by Monsen et al29 who described the profile of a
super-donor (frequent blood donor) as being of large body.
An increased number of menstruating days per year
(>65 days) was associated with a 2.5 times increased likelihood
of iron deficiency, compared to fewer menstruating days (<65 days).
Evidence of an inverse association between ser 1000 um ferritin concentration
and the duration of menses has been provided by other investigators15,23,30.
OCP use was not found to be significantly associated with iron deficiency
in the present model. However, as the OCP reduces the duration of
menstruation, its effect may have already been accounted for in the
menstrual score.
The iron status of students was found to be comparable
to the iron status of premenopausal women surveyed in recent Australian
studies. However, a relatively large proportion of women (one in five)
had low iron stores as defined by a serum ferritin <20 m g/L. The factors affecting iron stores were social status, haem iron
intake, calcium intake, BMI, recent blood donation, and menstrual
score. Haem iron intake decreased the likelihood of becoming iron
deficient, whereas a high calcium intake, high social status, high
menstrual score and a recent history of blood donation by subjects
with BMI<24 increased the likelihood of becoming iron deficient.
Of all these factors, increasing haem iron intake is the most appropriate
and easily modifiable factor for public health intervention. In order
to decrease the prevalence of iron deficiency in this population,
haem iron consumption (meat, chicken fish) should be increased, but
separately from the main calcium containing meals. Further research
is necessary to determine whether iron stores are affected by separating
high calcium meals from high iron meals.
Acknowledgment. This research was conducted at the School of Public Health, Curtin
University of Technology, Perth, where the first author is undertaking
doctoral research. This research was supported in part by a grant
from Kellogg (Aust) Pty Ltd. The authors would like to thank the staff
at the Health Service, Curtin University of Technology for their valuable
assistance.
References
- DeMaeyer E, Adiels-Tegman M. The prevalence of
anaemia in the world. World Health Statistics Quarterly 1985; 38:
302-316.
- English RM, Bennett SA. Iron status of Australian
children. Med J Aust 1990; 152: 582-586.
- National Heart Foundation. Iron status 1989- Draft
Report, Oct 1991.
- Helman AD, Darnton-Hill I. Vitamin and iron status
in new vegetarians. Am J Clin Nutr 1987; 45: 785-789.
- Cobiac L, Baghurst K. Iron status and dietary iron
intakes of Australians. Food Australia 1993; 45: S1-S24.
- National Health and Medical Research Council. Recommended
Dietary Intakes for use in Australia. Canberra: Australian Government
Publishing Service, 1991.
- Gleerup A, Rossander-Hulten L, Gramatkovski E,
Hallberg L. Iron absorption from the whole diet: comparison of the
effect of two different distributions of daily calcium intake. Am
J Clin Nutr 1995; 61: 97-104.
- Leggett BA, Brown NN, Bryant SJ, Duplock L, Powell
LW, Halliday JW. Factors affecting the concentration of ferritin
in serum in a healthy Australian population. Clin Chem 1990; 36:
1350-1355.
- Daniel A. Power, privilege and prestige: occupations
in Australia. Melbourne: Longman-Cheshire. 1983
- Australian Bureau of Statistics. Women’s Health.
Catalogue No 4365.0, Australia 1994.
- Wheeler CE, Rutishauser IHE, O’Dea K. Comparison
of nutrient intake data from t 1000 wo food frequency questionnaires
and weighed records. Aust J Nutr Diet 1995: 52: 140-148.
- Rangan AM, Ho R, Blight GD, Binns CW. Haem iron
content in Australian meats and fish. Food Australia (submitted
1996).
- Goldberg GR, Black AE, Jebb SA, et al. Critical
evaluation of energy intake data using fundamental principles of
energy physiology: 1. Derivation of cut-off limits to identify under-recording.
Eur J Clin Nutr 1991; 45: 569-581.
- Siedel JA, Wahlefeld AW, Ziegenhorn J. Improved
FerrozineR-based reagent for the determination of serum iron (transferrin
iron) without deproteinization [abstract]. Clin Chem 1984; 30: 975.
- Fogelholm M, Alopaeus K, Silvennoinen T, Teirila
J. Factors affecting iron status in non-pregnant women from urban
South Finland. Eur J Clin Nutr 1993; 47: 567-574.
- Willett WC. Nutritional Epidemiology. Monographs
in epidemiology and biostatistics. Volume 15 Oxford University Press.
New York 1990.
- Hallberg L, Bengtsson C, Lapidus L, Lindstedt G,
Lundberg PA, Hulten L. Screening for iron deficiency: an analysis
based on bone-marrow examinations and serum ferritin determinations
in a population sample of women. Brit J Haem 1993; 85: 787-798.
- Power C, Robertson F. Participation and equity
in higher education: Socio-economic profiles of higher education
students revisited. Austr Bulletin of Labour 1986; 13: 108-119.
- Wardle J, Marshland L. Adolescent concerns about
weight and eating; a social-developmental perspective. J Psychosom
Res 1990; 34: 377-391.
- Preziosi P, Hercberg S, Galan P, Devanlay M, Cherouvrier
F, Dupin H. Iron status of a healthy French population: Factors
determining biochemical markers. Ann Nutr Metab 1994; 38: 192-202.
- Worthington-Roberts BS, Breskin MW, Monsen ER.
Iron status of premenopausal women in a university community and
its relationship to habitual dietary sources of protein. Am J Clin
Nutr 1988; 47: 275-279.
- Alexander D, Ball MJ, Mann J. Nutrient intake and
haematological status of vegetarians and age-sex matched omnivores.
Eur J Clin Nutr 1994; 48: 538-546.
- Galan P, Hercberg S, Soustre Y, Dop MC, Dupin H.
Factors affecting iron stores in French female students. Hum Nutr
Clin Nutr 1985; 39C: 279-287.
- Gregory J, Foster K, Tyler H, Wiseman M. The Dietary
and Nutritional Survey of British Adults. Office of Population Censuses
and Surveys. London: HMSO 1990.
- Horwath CC. Dietary intake and nutritional status
among university undergraduates. Nutr Res 1991; 11: 395-404.
- National Institutes of Health Consensus Conference.
Optimal calcium intake. JAMA 1994; 272: 1942-1948.
- Takkunen H, Seppanen R. Iron deficiency and dietary
factors in Finland. Am J Clin Nutr 1975; 28: 1141-1147.
- Milman N, Kirchhoff M. Influence of blood donation
on iron stores assessed by serum ferritin and haemoglobin in a population
survey of 1359 Danish women. Ann Haematol 1991; 63: 27-32.
- Monsen ER, Critchlow CW, Finch CA, Donohue DM.
Iron balance in superdonors. Transfusion, 1983; 23: 221-225.
- Larsson G, Mi 562 lsom I, Lindstedt G, Rybo G.
The influence of a low-dose combined oral contraceptive on menstrual
blood loss and iron status. Contraception 1992; 46: 327-34.
Factors affecting iron status in
15-30 year old female students
AM Rangan, I Aitkin, GD Blight, CW
Binns
Asia Pacific Journal of Clinical
Nutrition (1997) Volume 6, Number 4: 291-295
Copyright © 1997 [Asia Pacific Journal of Clinical
Nutrition]. All rights reserved.
to the top
0