1000
Asia Pacific J Clin Nutr (1997) 6(2): 80-83
Asia Pacific J Clin
Nutr (1997) 6(2): 80-83

Glycaemic
response to selected Kerala breakfast
items in people with diabetes
Latha Vijayan MSc and S Sumathi PhD
Department of Foods and Nutrition,
Andhra Pradesh Agricultural University, India
The glycaemic response (index) to four commonly
consumed breakfast items of Kerala, namely puttu, idiappam, appam
and tapioca was studied in six non-insulin dependent diabetic Malayalee
men. All the breakfast items were isoenergetic and had almost similar
nutrient composition. The glycaemic response to breakfast items
as compared to that of glucose was determined by comparing the areas
under the 2 hour glucose response curves.
The mean peak rise over fasting levels was significantly
lower (P<0.05) only after puttu consumption whereas the mean
area under curve was significantly lower (P<0.05) after consumption
of puttu, idiappam and tapioca when compared to the oral glucose
tolerance test. The mean glycaemic response to puttu was found to
be the lowest (0.79) of the breakfast items tested, followed by
that of idiappam and appam. Tapioca elicited a glycaemic response
almost similar to that of glucose load. The differences observed
in the glycaemic response to different breakfast items may be due
to differences in carbohydrate chemistry or physical form of food
(particle size) and also dependant on method of processing.
Key words: Diabetes, non-insulin
dependent, carbohydrate foods, glycaemic response, glycaemic index,
Kerala, India, puttu, idiappam, appam, tapioca, breakfast
Introduction
Diabetes mellitus - a complex metabolic disorder-
is a common disease affecting 2-4% of the Indian population, and a
majority of them (90%) are diagnosed as non-insulin dependent diabetes
mellitus (NIDDM)1. In the management of NIDDM, diet has
been recognised as a cornerstone of therapy.
During the past few decades, dietary modification
in the treatment of diabetes mellitus has advanced from alterations
in nutrient constituents (mainly carbohydrate, CHO) of a meal to alterations
in the whole meal itself. Recent studies2,3 have suggested
that not only should the carbohydrates ingested be considered when
planning a diet for those with diabetes, but also the biological equivalents
(that is, quantities of food yielding the same effect on blood glucose)
or the glycaemic response (index) of a food. For an effective dietary
management of diabetes, it is better to modify the diet appropriate
to the individual lifestyle, taking into consideration traditional
eating patterns for better and longer compliance. The glycaemic responses
of common Indian breakfast items have been studied4-6,
but there is a paucity 1000 of data on the glycaemic responses of
the typical cereal (rice) based preparations of Kerala. Hence, this
study assessed the glycaemic response of some breakfast items commonly
consumed by Keralites in non-insulin dependent diabetic subjects.
Materials
and methods
Six non-insulin dependent Malayalee men with diabetes
aged between 40-51 years taking oral hypoglycaemic drugs and free
from any other major complications participated in the study. Internationally
accepted ethical practices in the conduct of human research have been
adhered to during the experimental period. The four breakfast items
tested namely puttu, idiappam, appam and tapioca were isoenergetic
(~390 Kcal) and had similar nutrient contents. The first three breakfast
items are rice based with a difference only in the method of preparation
and the fourth one is a root vegetable. The preparative methods are
in Table 1. All the rice-based breakfast items were served with bengal
gram curry. A cup of tea was served with the breakfast items. Nutrient
composition of breakfast items computed on the basis of Nutritive
Value of Indian Foods7 is given in Table 2.
Table 1. Breakfast items - ingredients and
preparation.
| Item |
Ingredients
|
Raw weight (g)
|
Preparation
|
Cooked weight (g)
|
| Puttu |
Rice flour
Tender coconut
|
75
25
|
Moisten flour, steam over boiling water
|
150
|
| Idiappam |
Rice flour
Tender coconut
|
75
25
|
Make dough with warm water, extrude & steam
|
200
|
| Appam |
Rice flour
Tender coconut
|
75
25
|
Make a thin batter, ferment, cook in a frying pan
|
180
|
| Curry |
Bengal gram (whole)
Onions
Oil
|
20
10
5
|
Cook gram, saute onions and add seasonings
|
100
|
| Boiled tapioca |
Tapioca
Oil (for seasoning)
|
190
10
|
Cut into small cylindrical pieces and cook, season
|
190
|
| Tea |
Skim milk
Tea
|
50
50
|
-
|
-
|
Table 2. Nutritive value of breakfast items.
| Breakfast items |
Energy (Kcal)
|
CHO (g)
|
Protein (g)
|
Fat (g)
|
Fibre (g)
|
| Puttu Curry |
269.0
122.0
391.0
|
60.2
13.3
73.5
|
5.3
3.4
8.8
|
0.7
6.1
6.8
|
0.2
0.8
1.0
|
| Idiappam Curry |
269.0
122.0
391.0
|
60.2
13.3
73.5
|
5.3
3.4
1000 8.8
|
0.7
6.1
6.8
|
0.2
0.8
1.0
|
| Appam Curry |
267.9
122.0
389.9
|
58.9
13.3
72.2
|
5.2
3.4
8.6
|
0.7
6.1
6.8
|
0.2
0.8
1.0
|
| Boiled tapioca (seasoned) |
388.3
|
72.2
|
1.3
|
10.4
|
1.1
|
| Tea* |
15
|
2.3
|
1.2
|
-
|
-
|
* Served with each breakfast
The subjects were requested to avoid taking drugs
24 hours prior to the test. An interval of at least two days was given
between two successive test preparations. The breakfast items were
prepared independently for each subject after weighing the required
ingredients. The time taken for consumption of the entire breakfast
item was 10 minutes. On the first visit, an oral glucose tolerance
test was conducted using 75g glucose load as recommended by the WHO
Expert Committee8. Fasting and post-prandial blood samples
at half-hourly intervals for 2 hours were drawn intravenously after
consumption of each breakfast item/glucose. The blood samples (3 ml)
were collected into test tubes containing 50 mg of NaF, centrifuged
immediately for separation of plasma and stored at 4°C. Plasma glucose
was estimated by glucose-oxidase-peroxidase method using Boehringer
Mannheim kit.
The area under the 2-hour glucose stimulation curve
(AUC) was calculated for each subject by summing up the four glucose
values obtained after stimulation and similarly for each test meal5.
Glycaemic response of each food item was calculated as follows 5.
Glycaemic response (GR) =
AUC of breakfast item
AUC of glucose
Statistical analysis used the paired t-test. This
differs from the "glycaemic index (GI)" of foods where respo
1000 nse to the same amount of carbohydrate from a reference food
is used to calculate the index, although, in reality, breakfasts contained
72-74g CHO, compared to 75g glucose load on reference.
Results
The mean plasma glucose responses of the subjects
fed different breakfast items are presented in Table 3.
Table 3. Mean plasma glucose values of the
subjects in response to the different breakfast items. Mean± S.D
| Plasma
glucose (mg/dl) |
Items tested
(n = 6) |
Fasting
|
1/2hr
|
1hr
|
1 1/2hr
|
2 hrs
|
Mean peakrise over fasting
blood glucose levels (mg/dl)
|
Glycaemic response
|
| Glucose |
186±37
|
319±92
|
358±96
|
386±109
|
338±72
|
210.18a±71.27
|
1.00
|
| Puttu |
163±42
|
233±66
|
327±84
|
302±91
|
260±99
|
164.2b±47.77
|
0.79±0.11
|
| Idiappam |
182±57
|
262±64
|
357±119
|
324±109
|
284±99
|
174.53a±75.95
|
0.86±0.10
|
| Appam |
189±47
|
252±53
|
362±105
|
337±61
|
308±55
|
191.7a±56.1
|
0.90±0.11
|
| Tapioca |
193±53
|
277±62
|
377±86
|
339±74
|
321±76
|
183.57a±52.96
|
0.93±0.04
|
Values with different superscripts are significantly
different (P<0.05). All values are compared with glucose.
The mean plasma glucose values at each time point
following the intake of puttu were not significantly different (P>0.05)
compared to glucose. However, for the two breakfast items, idiappam
and appam, 1000 the values at almost all the time points except at
1 hour (when peak was observed) were lower. The glycaemic response
of tapioca was very similar to that of glucose.
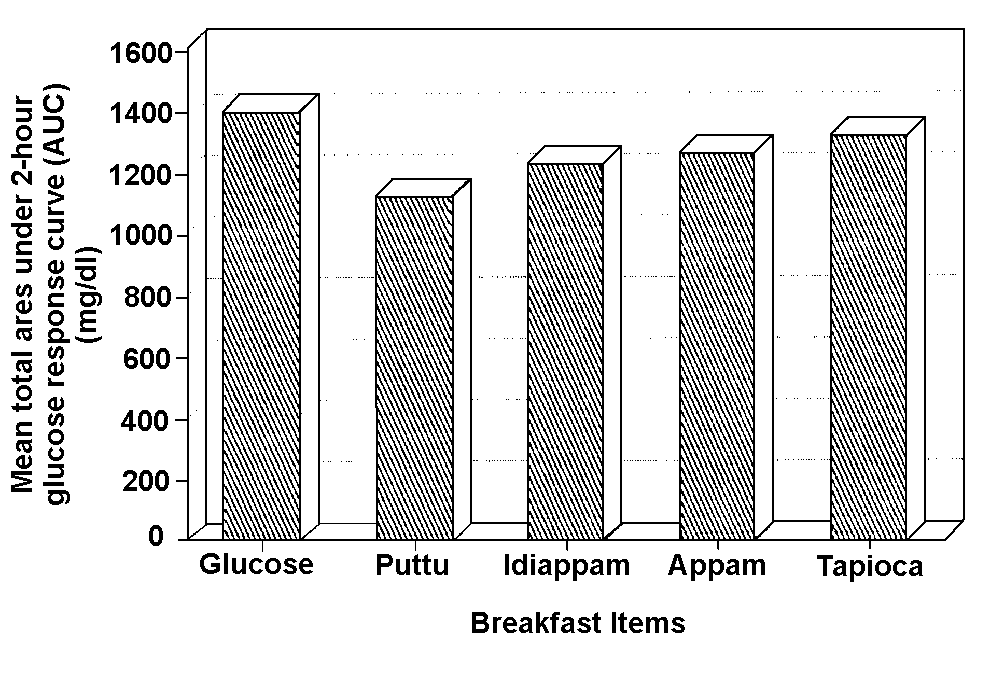
The mean total AUC or the overall glycaemic stimulus
was significantly lower (P<0.05) following the stimulation of only
puttu and idiappam compared to glucose and is represented in Figure
1. Also, the mean peak rise over fasting was significantly lower after
administration of puttu when compared to that of glucose (Table 3).
The values obtained after consumption of other breakfast items were,
however, not significantly lower (P>0.05) than that of glucose.
The glycaemic response of puttu was found to be the
lowest (0.79± 0.11) of the four breakfast items tested followed by idiappam (0.86± 0.10). The glycaemic responses of appam and tapioca were found to be
the highest and almost similar to that of glucose. No significant
difference (P>0.05) was found in the glycaemic responses among
the different breakfast items themselves.
Figure 1. Comparative areas under 2-hour glucose
response curve (AUC) for food items.

Discussion
In the present study, the mean glycaemic response
(GR) to puttu was found to be the lowest of the four breakfast items
tested. All the breakfast items were isoenergetic (~390 Kcal) and
had similar CHO content. Thus, differences observed in GR will be
mainly due to type and form of CHO available from each food item and
to the presence of non-CHO constituents, that is, fats, proteins and
non-digestible (non-glycaemic) CHOs. The breakfast items tested had
relatively low protein contents (less than 10g) and thus unlikely
to impact on GR since it is protein at intakes greater than 25g that
seems to blunt the rate of increase in blood glucose9,10.
The fat content of the breakfast items was low and unlikely to have
influenced GR . The dietary fibre content of the test items also seems
to have had little effect on the rate of food digestion and absorption,
and hence on the GR, as all the breakfast items elicited mean peak
glucose levels at the same time point (1 hr); this is despite the
presence of Bengal gram in the breakfasts based on puttu, iddiapam
and appam. So, in this study, the nature and form of CHO seems to
have affected GR. Tapioca elicited a higher GR though it had a slightly
low CHO content (72g) than others (73.5g) probably due to the type
of CHO in tapioca. Similarly, the high GR of appam among the rice
based breakfast items highlights the probable importance of physical
form in the physiological response to a food.
The rice based breakfast items differed only in the
processing method and the particle size of rice flour, with the ingredients
being almost the same (rice flour, coconut and bengal gram curry).
Puttu, which elicited the lowest GR among the breakfast items tested,
is prepared by moistening the coarse rice flour and steaming over
boiling water. Idiappam is made from finer rice flour, which is worked
into a soft dough. The extruded dough is then steamed. Appam, the
breakfast item that elicited a higher GR, is prepared by pan frying
a fermented batter of rice, coconut milk and toddy (a naturally fermented,
non-alcoholic drink obtained from the palm or coconut palm tree).
The larger particle size of the moistened rice flour
of puttu could have affected the degree of gelatinisation of starch
while cooking, with a relatively complete gelatinisation in idiappam,
thus increasing the rate of digestion and absorption and hence an
increased GR. Similar results were reported by Susan et a 1000
l11, who found that glycaemic index correlates positively
with degree of gelatinisation and with the amount of starch digested.
O’Donnell et al12 demonstrated the effect of
particle size on GR. They reported that bread made from coarse flour
resulted in lower plasma glucose and insulin concentration than that
made from fine flour. It should be noted, however, that if gelatinised
starch is cooled it becomes more resistant to digestion ("resistant
starch").
Idiappam is a preparation that is comparable to spaghetti
because it undergoes similar processing. Jenkins et al13
have reported that flour in the form of spaghetti raises blood glucose
levels significantly less than when the same amount of CHO is eaten
as bread. Thus, idiappam may lower GR due to processing, for example,
to resistant starch formation.
The relatively higher GR of appam could be attributed
to the wet grinding and fermentation of rice prior to cooking, leading
to complete gelatinisation of starch and enhanced rate of starch digestion
of the product. It has been reported that fermentation of pearl millet
sprouts, green gram and sorghum significantly increases protein and
starch digestibility14,15. Various other studies have also
demonstrated that there is no significant difference in the metabolic
responses to ground brown rice (complex CHO) and glucose (simple CHO)16,17
In the present study too, the mean AUC of appam was not significantly
different from that of glucose.
Tapioca (a root vegetable) and appam (a rice product)
elicited similar GRs. In the preparation of appam, the physical process
of breaking the rice starch into smaller particles seems to have eliminated
the factors intrinsic to the whole food which would have led to different
glycaemic potencies in these two different sources of CHOs. Similar
findings have been reported by Crapo and Henry18, namely
that differences in metabolic responses to two common starches (rice
and potato) could be eliminated by altering the physical form (blended
to form a slurry). They suggested that differences in glycaemic potencies
of different starch containing foods are not due only to variations
in the starch molecule per se, but rather to the way it is presented
to the gastro intestinal tract digestive and absorptive process. Blending
leads to dispersion and hydration of starch, which could be an important
factor in absorption and hence, determination of GR.
These data thus provide information helpful in the
design of diets for people with diabetes which contain unrefined CHO
in a form which is digested and absorbed slowly. However, food culture
and preference would still need to be considered despite the overall
beneficial impact of the glycaemic response differences.
Conclusion
The differences observed in the glycaemic response
to different breakfast items in subjects with NIDDM in the present
study may have been due to differences in CHO chemistry, physical
form of food or the method by which it was processed.
Puttu had a comparatively lower GR (0.79) compared
to glucose than did other breakfast items from Kerala and is therefore
more suitable for those with diabetes. Thus, even traditionally used
cereal based food items may be chosen to contribute to lower GR in
diabetes.
References
- Raghuram TC, Swaran Pasricha and Sharma RD. Diet
and Diabetes. National Institute of Nutrition, Indian Council of
Medical Research, Hyderabad. 1991;l-5.
- Jenkins DJA, Wolever TMS, Taylor RH, Barker HM,
Fieldon H, Baldwin JM, Bowling AC 1000 , Newman HC, Goff DV and
Jenkins AL. Glycaemic index of foods: A physiological basis for
carbohydrate exchange. Am J Clin Nutr 1981; 34: 362-366.
- Crapo PA, Reaven G, Olefsky J. Post-prandial plasma
glucose and insulin responses to different complex carbohydrates.
Diabetes 1977; 26:1178-83.
- Raghuram TC, Swaran Pasricha, Upadhyaya AC and
Krishnaswamy K. Glycaemic index of Indian foods, Diabetes Bull 1987;
V 7 : 1-2.
- Vishwanathan M, Snehalatha C,Ramachandran A, Mohan
V, Revathy M, Paul S, Indira S and Kymal PK. Glycaemic and insulin
responses to some breakfast items in diabetic subjects. Nutrition
Reports International 1988; 37(a): 409-418.
- Vimala CKW and Easwaran PP. Glycaemic indices of
selected South Indian breakfast items. The Indian Journal of Nutrition
and Dietetics 1988; 25: 1-6.
- Narsinga Rao BS, Deosthale YG and Pant KC. Nutritive
value of Indian Foods. Indian Council of Med Research, Hyderabad.
1991.
- World Health Organisation. Expert Committee report
on diabetes mellitus. Technical Report Series 1980; No.646 WHO Geneva.
- Seino Y, Seino S, Ikeda M, Matsukura S and Imura
H. Beneficial effects of high protein diet in the treatment of mild
diabetics. Human Nutrition : Applied Nutrition 1983; 37A: 226-230.
- Seino Y, Ikeda M, Matsukura S and Imura H. Blood
glucose and plasma insulin of mild diabetic patients in response
to high protein divided meals. Human Nutrition: Applied Nutrition
1983; 37A(3): 222-225.
- Ross SW, Brand JC, Thornburn AW and Truswell AS.
Glycaemic index of processed wheat products. Am J Clin Nutr 1987;
46: 631-635.
- O’Donnell LJD, Emmett PM, Heaton KW. Size
of flour particles and its relation to glycemia, insulinaemia and
colonic disease. British Medical Journal 1989; 298(6688): 1616-1617.
- Jenkins DJA, Wolever TMS, Jenkins AL, Thorne MJ,
Lee R, Reichert R and Wong GS. The glycaemic index of foods tested
in diabetic patients: A new basis for carbohydrate exchange favouring
the use of legumes. Diabetologia 1983; 24: 257-264.
- Chavan VD, Chavan JK and Kadam SS. Effect of fermentation
on soluble proteins and invitro protein digestibility of sorghum,
green-gram and their blends. J of Food Science 1988; 53(5): 1574-1575.
- Khetarpaul N and Chauhan BM. Effect of germination
and fermentation on invitro starch and protein digestibility of
pearl millet. Journal of Food Science 1990; 55(3): 883-884.
- O’Dea K, Snow P and Nestel PJ. Rate of starch
hydrolysis in vitro as a predictor of metabolic responses
to complex carbohydrate in vivo. Am J Clin Nutr 1981; 34:
1991-1993.
- Collier G and O’Dea K. Effect of physical
form of carbohydrate on the postprandial glucose, insulin and gastric
inhibitory polypeptide responses in type-2 diabetes. Am J Clin Nutr
1982; 36:10-14.
- Crapo PA and Henry R. Postprandial metabolic responses
to the influence of food form. Am J Clin Nutr 1988; 48: 560-564.
Glycaemic response to selected Kerala
breakfast items in people with diabetes
Latha Vijayan and S Sumathi
Asia Pacific Journal of Clinical Nutrition (1997) Volume 6, Number 2: 80-83

Glycaemic response to selected Kerala
breakfast items in people with diabetes
Latha Vijayan and S Sumathi
Asia Pacific Journal of Clinical Nutrition (1997) Volume 6, Number
2: 80-83


Copyright © 1997 [Asia Pacific Journal of Clinical
Nutrition]. All rights reserved.
to the top
0