Asia Pacific J Clin Nutr
(1995) 4, Suppl 1, 13-18
![]()
The nutrient intakes of Chinese children and adolescents and their impact on growth and development
Ye Guang-Jun, MD
Professor, Director, Institute of Child and Adolescent Health, Beijing Medical University, Beijing, China
Considerable improvement has taken place in the growth and development of children and adolescents in China since 1949, and even since 1931, with the notable exception of war-time. There are interesting comparisons with Japan, with developing and developed nations, which provide insights into preferred eating patterns for children. These are borne out by intra-China analyses of rural and urban populations (urban generally fairing better), of majority Han and minority groups, of socio-economically advantaged and disadvantaged, and of regional populations. Energy intake and food nutrient density need, as expected, to be adequate. But particular problems remain, especially with iron, and Vitamin B-2, and probably with calcium, Vitamins A, B-1 and C intakes, although more often for marginal than frank deficiency. A "two-peak phenomenon" is also emerging in China, where about 80% of children aged 0-4 in urban areas, and 20-45% in rural areas, are only-children; this is that overfatness may co-exist with undernutrition. Primary health care in China is increasingly challenged by these dilemmas.
Introduction
Children and adolescents are a population subset experiencing physical, mental and psychosocial development. Nutrition is a most important basis for growth and development. Enough energy, protein, vitamins, minerals and trace elements are needed by children and adolescents for rapid growth and development and related metabolism. Nutrient deficiency, an imbalance in nutrient intake , and poor food choice can lead not only to slower growth and development, but also to acute and chronic malnutrition and various kinds of nutrient deficiency.
China is a developing country. As the living standard of the people rises, the nutrient intake of children and adolescents is better than ever, and thus greatly promotes growth and development. This has been verified by the statistical data from three large-scale survey studies on the physical fitness and health of Chinese students in 1979, 1984 and 19911,2,3. China now has a population of more than 1.1 billion. Among them, about 400 million are children and adolescents aged 0 through 18 years old, which account for 35.7% of the whole population. There are 20 million new births every year. The number of only-children is also increasing. In urban areas, 79-80% of the children aged 0-4 years are only-children, while the figure ranges from 20% to 45% in rural areas4.
The present article begins with changes in secular growth of Chinese children and adolescents since 1949, which can be attributed largely to the improvement in nutrition of the Chinese people 1000 .
Secular Growth Changes of Chinese Children and Adolescents
Since the 1950s, a secular trend in children's growth has been obvious in China5. This trend has three characteristics:
| The height and weight of children and adolescents are the most basic and feasible indices for evaluation of nutritional status. Table 1 shows that the average increase in height per decade among Chinese urban boys aged 7, 11, 14 and 17 was 1.94cm, 3.00cm, 3.69cm and 1.75cm, respectively. Among the girls of the same ages it was 1.88cm, 3.30cm, 2.34cm and 1.32cm, respectively. Similarly, the average increase in weight per decade was 0.74kg, 1.61kg, 2.70kg and 1.46kg among boys, and 0.57kg, 1.64kg, 1.63kg and 0.29kg among girls of the same ages, respectively. | Table 1. Increments
in height and weight per decade of Chinese boys and girls
aged 7 through 17 (1950’s-1985)5
|
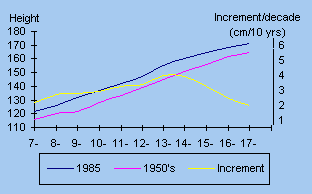
| Figure 1. The comparison of height and its change in Chinese boys between 1950’s and 1985 |  |
In Figure 1, the upper line is boys' mean heights at different ages in 1985, and the lower line are those in 1955. The third line displays ten year increments. The largest increments can be found in those aged 12 through 14, when the Chinese boys were usually in their adolescent growth spurt.
Because of these changes toward larger size, boys aged 14 and girls aged 13 today, for example, would be as tall as the boys aged 15.5 and the girls aged 15 would have been forty years ago, respectively.
During the last forty years, Chinese boys and girls have undergone advancement in adolescence, indicated by the earlier onset of adolescent growth spurt, both for height and weight. Take height as an example, the age of the spurt onset was 12.9 years among boys and 11.7 years among girls in 1950s, but it advanced to 12.1 years and 11.2 years respectively in 1991. Looking at weight, the age of the spurt onset was 13.8 years among boys and 12.9 years among girls in 1950s, but advanced to 12.4 years and 11.8 years respectively in 19913,6.
Ohsawa7 uses boys from Shanghai as an example. An evident "track phenomenon" could be found during the 54 years from 1931 to 1985 when the secular trend was shifting positively. There was a negative shift, both in height and weight in 1944, due to the difficult life of the Chinese people in World War II. However, the growth trend seemed to get back on "track" after that, and an acceleration of height occurred, especially among 14 year old boys. The trend for weight was not as obvious.
| The secular
growth changes of adolescents of four Chinese Minorities,
the Mongolian, Uygur, Tibetan and Chinese Korean
Nationalities, had their own growth patterns. However,
the changes toward larger size and earlier maturation are
quite similar to those of the Han boys and girls8. The causes of the Chinese children's secular growth changes are multiple. Control of infectious diseases, compulsory education, more available health and medical care, as well as social changes are possible contributing factors, However, the most important factor in these growth changes has been improved nutrition, especially increased energy-protein intake. Table 2 shows the changes in protein, sugar and fat intake in China during the last 40 years. Table 2 shows the change in eating patterns in China between 1950-1990. The consumption of vegetable oil, meats and aquatic products per capita per annum in 1990 were 1.70, 1.76 and 1.54 times those in 1950, respectively. The consumption of cereal foods only increased by 22% during this period. The consumption of eggs per capita per annum in 1990 were five times that of 40 years ago. This suggests that growth and dev 1000 elopment of Chinese adolescents, especially in height, is significantly related to the increase of animal protein intake9. |
Table 2. The
changes of intake of various kinds of food in China
during 1950-1990 (on average) (kg/yr)9
|
| Table 3
describes the changes in four kinds of food constituents
for Chinese urban and rural inhabitants from 1978 to 1985
and 1993. For urban people, the most significant changes
were increased consumption of animal protein and
decreased consumption of cereal foods. For rural,
consumption of animal protein per capita per annum
already increased from 7.7kg in 1978 to 18.4kg in 1993.
Compared with urban, however, their major protein source
was still cereal foods. Now, the question is: is the nutrition of all Chinese children and adolescents sufficient? The answer is that it is still not ideal. Generally, the intake of energy and protein remain insufficient. After other nutritional problems of Chinese children and adolescents in cities, such as being overweight or obese must receive more attention. This is being referred to as the "two-peak phenomenon" in nutritional status of Chinese children and adolescents. |
Table 3. The
changes of food constitution of Chinese urban and rural
inhabitants in 1978,1985 and 1993(kg/yr)9
|
||||||||||||||||||||||||||||||||||||||||||
| The
"Two-Peak Phenomenon" of Nutrition in Chinese
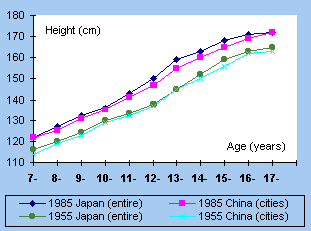
Children and Adolescents First, let us make some comparisons about food constituents, such as protein, fat and carbohydrate, between China and those in other countries. The protein and fat contents of the Chinese diet are much lower than those in developed countries, such as USA, United Kingdom, Germany, Australia, but are significantly higher than those in India, Indonesia, and Nigeria. However, just like the peoples living in other developing countries, most of the Chinese people's energy and protein intakes still come from cereals, not animal derived foods. Let us take two examples. Figure 2 compares the difference in height between urban Chinese boys and Japanese boys aged 7 to 17 in 1955 and 1985. No significant differences are found between the two countries. This suggests that Chinese and Japanese children and adolescents had similar secular growth changes during this period. In Table 5, it can be seen that, although China is a developing country, the incidence of LBW (low-birth-weight) infants is only about 9%. It is quite different from other developing countries, because maternal malnutrition during the fetal period is not a big problem in China10. Table 6 shows the Kaup Index of Chinese infants aged 5-6 months are significantly lower than that of the Japanese infants of the same age6,11. It suggests that among Chinese infants, the major problems are a lack in food supply and its insufficiency of energy and protein, although other nutrients could be involved. From 3-4 years of age, the Chinese infants’ Kaup index lagged behind that of the Japanese infants again. This phenomenon extended to the preschool period. It suggests children's energy supply and food nutrient density during the early years are important issues. |
Table 4. Comparison
of energy, protein and fat in food eaten by Chinese and
other populations9
|
|||||||||||||||||||||||||||||||||||||||||||||||||||||||||||||||||||||||||||||||||||||||||||||||||
| Figure 2. Comparison in height of Chinese and Japanese boys aged 7-17 between 1950’s and 19856 |  |
Table 5. The
worldwide incidence of LBW infants (%)10
|
Table 6. Comparison
of Kaup index between Chinese and Japanese infants and
preschoolers at different ages6,11
|
||||||||||||||||||||||||||||||||||||||||||||||||||||||||||||||||||||||||||||||
Table 7. Prevalence
of malnutrition in Chinese children under 5 years in 1985
(According to WHO norms)12
According to the WHO weight-for-age, height-for-age and weight-for-height norms, the most severe problem of Chinese preschool children is the insufficiency of body weight. The prevalence of underweight children is as high as 20-25% in rural areas. The adequacy of height, or stuntedness, is also significant among rural children (Table 8). |
Table 8. Comparison
of body size between Chinese urban and rural children
aged 6 years old in 198512
|
||||||||||||||||||||||||||||||||||||||||||||||||||||||||||||||||||||||||||||||
Comparisons of growth status among preschool children show that those living in Beijing and Tianjin have the best status and those living in Southwest China have the poorest status. Significant urban-rural differences can be seen in each province. Take the 6-year-old children living in Southwest China as an example, the urban-rural difference is 6.2cm for height and 1.5kg for weight12.
Table 9. The
prevalence of malnutrition of preschool children in
Jiangxi and Guizhou Provinces12
|
Table 10.
Prevalence of Nutritional problems among Chinese rural
youths (%)3
|
||||||||||||||||||||||||||||||||||||||||||||||||||||||||||||||||||||||||||||||||||||||||||||||||||||||||
Table 9 shows that in some Chinese rural areas, the prevalence of underweight and underheight, according to the WHO norms, is quite high. These data come from several Chinese rural areas where the socioeconomic levels are the lowest. From now on, the improvement of energy-protein intake of children in these areas will be one of the main intervention strategies of primary health care.
The same conclusion can be drawn from Table 10. The prevalence of marginal malnutrition is still quite high in Chinese rural areas, especially among the girls. Being overweight or obese are not common at present.
Table 11.
Prevalence of nutritional problems among Chinese urban
youths (%)3
However, a paradoxical phenomenon among urban adolescents can be found in Table 11. The prevalence of marginal malnutrition is quite high, especially among girls who are in their adolescent growth spurt. On the other hand, the prevalence of overweightness and obesity, especially among boys, is rather high. This is the "two peak phenomenon". According to another investigation, the prevalence of obesity in Chine 1000 se cities tripled during the 1985-1992 period. Thus prevention of child and adolescent obesity due to over nutrition will be another intervention confronting primary health care. |
Table 12. The
nutrient intakes of Chinese pre-school children and the
comparisons with China’s RDA and WHO RDA.12
|
180 |
||||||||||||||||||||||||||||||||||||||||||||||||||||||||||||||||||||||||||||||||||||||||||||||||||
| Vit B-2 | 0.4 mg |
49 |
45 |
|||||||||||||||||||||||||||||||||||||||||||||||||||||||||||||||||||||||||||||||||||||||||||||||||
| Niacin | 8 mg |
92 |
75 |
|||||||||||||||||||||||||||||||||||||||||||||||||||||||||||||||||||||||||||||||||||||||||||||||||
| Vit. C | 34 mg |
85 |
170 |
|||||||||||||||||||||||||||||||||||||||||||||||||||||||||||||||||||||||||||||||||||||||||||||||||
This section will focus on the problems of Chinese children's intake of nutrients other than energy-protein.
Table 12 suggests that Chinese children have insufficient intakes of calcium and Vitamin B-2. As far as calcium intake is concerned, there is a shortage of milk for children to drink, especially in large rural areas. But there may be some aspects of Chinese food content which compensate for apparently low calcium intakes. Comparisons with both Chinese and WHO RDAs show that Fe intake is sufficient. But the fact that most of these nutrients come from plant food and are difficult to absorb must be taken into consideration. Nutrients that need to be bolstered in Chinese children's food are calcium, iron, Vitamin A and Vitamin B-2.
From Table 13, it can be concluded that serious deficiencies of Vitamin A, B-1 and B-2 are rare among Chinese children, and most occur in the low socioeconomic areas in Northwest China. The prevalence of Vitamin C deficiency is not high, but has appears seasonally in spring and winter. However, there is a high prevalence and high popularity of marginal nutrient deficiencies.
Anemia caused by iron-deficiency and rickets caused by Vitamin D or calcium deficiency have major impacts on the growth and development of Chinese children and adolescents.
Table 14 shows that the prevalence of rickets among Chinese infants is still very high. Its overall characteristics are:
(1) the prevalence is higher in rural areas than urban areas; (2) the prevalence is significantly higher in the North than in the South;
(3 1000 ) the peak of prevalence is in spring following the long winter with inadequate sunshine;
(4) about 62% of suffering infants and children are younger than one year old. However, most of these infants are mild cases. Their occurrence can be alleviated by attention during pregnancy, an increase in outdoor activities, and increases in calcium, phosphorus and Vitamin D intakes14,15,16.
Table 15 shows the prevalence of iron-deficiency anemia of Chinese infants and young children aged 0 through 4. According to the 110g Hb/ L cut-off for anemia, the prevalence is high, even as high as 82.7% among some rural areas in several provinces around the Yangtze Valley18.
In Table 16, it can be seen that the incidence of iron-deficiency anemia is high among Chinese children and adolescents aged 7 through 17, especially if rural and puberal. The prevention of iron-deficiency anemia is not only part of the "four major disease-control in early-childhood (rickets, iron-deficiency, pneumonia, diarrhea )", but also one a major goal of adolescent health care.
Vit A |
Vit B-1 |
Vit B-2 |
Vit C |
|
| Deficiency | 2.9 |
0.4 |
5.8 |
1 |
| Marginal deficiency | 40.3 |
20-32 |
29-52 |
9-28 |
Table 14. Prevalence of rickets among Chinese pre-school children (%)14
Urban 1000 |
Rural |
|
| North China | 13.2 |
40.6 |
| South China | 5.3 |
25.1 |
Table 15. Prevalence of iron deficiency anemia among Chinese pre-school children (%)17
| Geographic Area | Urban |
Rural |
| South China | 55.7 |
63.5 |
| Southeast China | 64.1 |
82.7 |
| North China | 40.5 |
45.9 |
Table 16. Prevalence of iron deficiency anemia among Chinese youth (%)3
Age |
Urban |
Rural |
Total |
||
(yr.) |
boy |
girl |
boy |
girl |
|
7- |
14.46 |
18.32 |
21.81 |
22.48 |
19.24 |
9- |
13.04 |
15.38 |
19.11 |
21.11 |
17.14 |
12- |
28.00 |
23.37 |
31.30 |
26.67 |
27.35 |
14- |
13.94 |
18.66 |
20.04 |
21.61 |
18.55 |
17 1000 |
15.91 |
23.40 |
14.65 |
23.66 |
19.39 |
Child and adolescent iodine-deficiency and endemic diseases caused by excessive fluorine intake, although they belong to the field of nutrition, will not be discussed here.
Among the factors that influence growth and development of children and adolescents, nutrition and physical activity are the most important. To promote growth and development of children and adolescents and prevent adulthood diseases during childhood, are major tasks in primary health care for children. Effective health education about nutrition should be provided. The target population should also include parents, administrative officers and personnel who are in charge of food arrangement at schools. Extensive nutrition education will promote child and adolescent health.
Acknowledgements
I am grateful to professor Chengye Ji, Professor Zhao Zhang, Mr. Jichao Sun for data and draft preparation for this article.
The nutrient intakes of Chinese children and adolescents and their impact on growth and development
Ye Guang-Jun
Asia Pacific J Clin Nutr (1995) 4, Suppl 1

References
![]()
Copyright © 1995 [Asia Pacific Journal of
Clinical Nutrition]. All rights reserved.
Revised: January 19, 1999.