|
|
Asia Pacific J Clin Nutr (1995) 4 Suppl 1, 24-28
Asia Pacific J Clin Nutr (1995) 4
Suppl 1, 24-28

Eating patterns-- a prognosis
for China
Chen Chunming, PhD
Chinese Academy of Preventive Medicine,
Beijing, People's Republic of China
China has shifted its dietary patterns because of
economic change. As people have more money to spend they buy more
processed food which tends to be energy-dense and nutrient-poor.
There are substantial differences in dietary patterns between urban
and rural populations. Rural residents tend to maintain the basic
traditional diet. while urban and richer rural residents tend to
consume more high-fat food and processed sugar-based foods. If no
action is taken to intervene or guide people's food consumption
behavior: consumption of cereals, sugar and vegetables will decline;
poultry consumption will increase; and the demand for beef, mutton,
eggs and milk will increase. An analysis of food consumption in
Shanghai during 1950-1982 revealed the mortality rate of heart disease,
cerebrovascular disease and cancer were positively correlated with
meat, egg and sugar consumption and negatively correlated with cereal
consumption. The projections for chronic disease based on demographic
change, risk factor and disease estimations indicate that by the
year 2030 in China, there will be annually 800,000 deaths by coronary
heart disease, 3 million from strokes and 1.7 million due to lung
cancer. These figures call for the government and public to take
timely actions to avoid over-consumption of animal foods. Although
disease pattern change is related to a series of factors, the role
nutrition plays in health promotion and disease prevention should
not be underestimated.
Introduction
During economic development, food production changes
to match the demand for food and food consumption behavior changes
with income increase. Therefore, dietary pattern transition is a consequence
of economic development. The major dietary changes in the United Kingdom
over the past 200 years (1770-1970) were: fat went from 25g per person
per day to 145g; sugar went from 10 to 150g; wheat flour declined
from 500g to 200g; and crude fiber was reduced from 5g to 0.2g1.
In the past 100 years (1850-1987) of the Japanese diet: rice intake
was reduced from 350g to 212g; meat increased from 5g to 71g; milk
increased from 0 to 118g; energy from fat increased from less than
5% to 24.5% accompanied by a reduction in energy share of carbohydrates
from 84% to 57%1. In developing countries, economic adjustment
policies, such as food exportation and increased demand for cash crops,
often signal dietary pattern changes. Substantial differences in dietary
pattern between urban and rural populations exist. Rural residents
tend to maintain the basic traditional diet. Urban residents, especially
the young generation who are influenced by local and international
food industries, now tend to consume more high-fat fo 1000 od, processed
sugar-based foods, soft drinks, alcohol and fast foods. The same trend
occurs in the better off rural areas where lifestyle is becoming more
urbanized. Traditional dietary patterns are under threat from the
modern world regardless of whether they are good or bad.
Figure 1 is an analysis of the available World Health
Organization (WHO) mortality data from 52 countries (with populations
over 1 million) and the per capita Gross National Product (GNP) data
from World Bank. It shows the mortality share of cancer and cardiovascular
disease of people aged 35-69 in relation to GNP. Countries with GNP
of US$1200 experienced a sharp increase of the two disease categories.
In countries with GNP of US$3000-4000, the burden of the two diseases
is nearly as great as in very affluent countries with average GNP
more than US$11,500. A modest increase in prosperity in populations
with low GNP seems to be associated with the most marked increase
in the share of these chronic diseases, which pose a major long term
burden on health services. The corresponding dietary changes of countries,
based on FAO data, given in Figure 2 demonstrate the progressive energy
from animal fat increase and that from carbohydrate decrease1.
| Figure 1.
Death from diseases in relation to GNP
Percentage of mortality (aged 35-69)
|
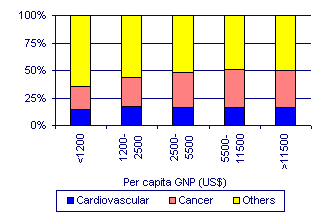
Source: WHO (population over 1 million)
and World Bank |
| Figure
2. Nutrient intake in relation to GNP
Percentage of energy
|
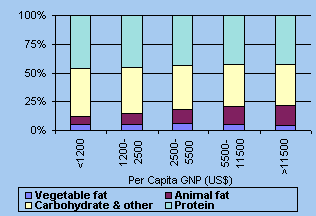
Source: FAO and World Bank |
In developing countries, communicable diseases will
still be the predominant public health morbidity problem in the next
decade. But with economic development, the prevalence and mortality
rate of non-communicable diseases will become a long-term economic
burden in terms of clinical health care costs and labor loss. Since
the share of chronic disease mortality has been increasing for the
past 20 years, its prevention and control is very critical. It is
neccessary both to protect people's health and to gain economic benefit.
China is now in this situation.
The evolution of food consumption and dietary patterns
of Chinese people
| Food consumption
In the early 1950’s, personal expenditure
was very low because socioeconomic limitations and low productivity.
The per capita expenditure was equivalent to a current value
of 76 Yuan RMB in 1952. After a 40 year effort, this increased
10 fold. Macro policies did not address the relationship between
production and spending, so that spending fluctuated during
this period of 1952-1988. Considered as 1952-1957, 1958-1978
and 1979-1988. Table 1 shows the variation in consumption of
several food items and in energy and in macronutrients.
The blocked increase during 1958-1978 reflected
macro policies. Since the implementation of economic reform
and the "Open Door" policy in 1000 1978, the income
and expenditure levels have significantly increased. Cereal
consumption reached around 250 kg, animal food doubled, including
an increase of pork by 90%, beef/ mutton by 100%, fish by 60%,
poultry by 3.5 times, eggs by 1.9 times, and vegetable oil consumption
by 2.7 times.
The above are data of national average consumption.
Data were collected at the household level in 6 Provinces and
Beijing Municipality in 19904. They illustrate the
food consumption of rural and urban households (Tables 2 and
3). There was a substantial difference between urban and rural
populations. The increasing consumption of animal food and vegetable
oil proved to be of similar magnitude. Along with the increase
of animal food consumption and oil consumption, cereal consumption
of urban households was reduced to around 120-150 kg per person
per year. All sources of information show vegetable consumption
was stable, at around 100-150 kg/ year for urban populations.
Dietary pattern
The Second Nationwide Nutritional Survey in
1982 indicated the national average of energy intake has reached
over 102% of the Recommended Dietary Allowance (RDA) for Chinese
people5. For the national consumption data from Table
1, the energy intake from cereals was 76% in 1978, declined
to 73.3% in 1984 and 69% in 1992. Fat energy was 13.8% in 1978
and increased to 21.3% in 1992. This shows the national average
change in dietary pattern.
Household data from 1990 (Table 4), show that
energy intakes of both urban and rural households meet RDA.
Fat intake of urban households was critically high with energy
share from fat in 4 out of 7 provinces/ municipalities was over
25% and energy from cereals 52-68%, just at the optimal level.
However, the dietary pattern of rural households lacked quality,
judged by food profile although average for fat enegy remained
less than 20%.
Future diet for the people of China
The following projection of the future diet
for Chinese people is based on: (1) food consumption behavior
of people, using urban household data of various income groups
in 1990, (2) income elasticity of food items, (3) food demands
of various categories of cities.
Food consumption behavior of income groups
The food consumption of income groups in urban
areas in 1990 showed an increase in meat consumption, but little
difference in cereal consumption among income groups. The meat
consumption of the lowest 10% income group was 11-32kg/ capita/
year; the lowest 10% of households (group 1) in SC Province
reached 32kg, only 5kg less than the highest 10% income groups
(group 6). Beijing, ZJ province, GD province are similar with
SC in differences between group 1 and 6. (Table 5).
Recommended dietary guidelines for China include6:
- Energy intakes of 2400kcal per day with 60%
from cereals;
- Protein intake of 70g per day contributing
14% of total energy intake, and 30-40% of protein intake from
the combination of animal and bean/ pulse sources;
- 25-30 % of total energy intake from fat;
- Salt int 1000 ake of less than 10 g per day.
Applying the principles of the Desirable Dietary
Pattern (DDP) developed by the Regional Expert consultation
of the Asian-Pacific Network for Food and Nutrition (ANFN)7
a "DDP-China for 2000" was designed (Table 6).
The quality of the dietary pattern can be evaluated by using
DDP scoring (see Table 6). If intake of food items are not in
balance with each other, the DDP score will be penalized.
|
Table 1. Variation in food
consumption (1952-1992)2,3
|
Year
|
Increase in:
|
Food consumption (kg/yr)
|
Nutrients
|
| |
Income
|
Expense
|
cereal
|
oil
|
animal food
|
Energy
kcal
|
Fat
(%) Energy
|
Prot
(g)
|
|
1952-1957
|
10.6
|
4.6
|
|
|
|
|
|
|
|
1952
|
|
|
197.7
|
2.1
|
11.0
|
|
|
|
|
1957
|
|
|
203.0
|
2.4
|
12.3
|
|
|
|
|
1958-1978
|
5.3
|
1.8
|
|
|
|
|
|
|
|
1978
|
|
|
195.5
|
1.6
|
14.3
|
1833
|
13.8
|
46.5
|
|
1979-1988
|
9.2
|
7.7
|
|
|
|
|
|
|
|
1984
1000 |
|
|
249.7
|
4.7
|
23.7
|
2532
|
17.1
|
61.0
|
|
1988
|
|
|
246.1
|
5.9
|
29.5
|
2625
|
17.8
|
62.8
|
|
1989
|
|
|
239.1
|
5.4
|
30.7
|
2535
|
19.1
|
60.9
|
|
1990
|
|
|
238.8
|
5.7
|
32.9
|
2524
|
20.2
|
61.3
|
|
1991
|
|
|
234.5
|
5.9
|
35.1
|
2550
|
20.7
|
61.0
|
|
1992
|
|
|
235.9
|
6.3
|
37.6
|
2597
|
21.3
|
62.2
|
Table 2. Household food consumption of
urban populations in 1990-- 6 provinces and Beijing3
(kg/capita/yr)
| |
BJd
|
HB
|
HL
|
NX
|
ZJ
|
GD
|
SC
|
| Cereals |
121
|
188 1000
|
162
|
151
|
121
|
123
|
129
|
| Animal food |
59
|
41
|
36
|
45
|
52
|
63
|
48
|
| Meata |
34
|
20
|
18
|
25
|
|
26
|
34
|
| Poultry |
5
|
3
|
4
|
8
|
5
|
8
|
6
|
| Egg |
14
|
12
|
8
|
7
|
9
|
13
|
4
|
| Fishb |
6
|
|
5
|
13
|
16
|
4
|
|
| Veg oil |
9
|
8
|
9
|
11
|
|
|
8
|
| Ani. fatc |
6
|
11
|
10
|
8
|
5
|
13
|
|
(a) including pork, beef and mutton (b) including
fish, shrimp and oysters
(c) added animal fat (d) BJ=Beijing Municipality, HB=Hebei Province,
HL=Helongjiang Province, NX=Ninxia Hui Autonomous Region, ZJ=Zeijiang
Province, GD=Guangdong Province, SC=Sichuan Province
Table 3. Household food consumption of
rural populations in 1990 (6 provinces and Beijing) 1000 (kg/capita/year)4
| |
BJd |
HB
|
HL |
NX |
ZJ |
GD |
SC |
| Cereals |
207 |
239 |
314 |
274 |
289 |
279 |
258 |
| Animal food |
18.1 |
8.7 |
17.3 |
12.4 |
19.6 |
27.8 |
21.2 |
| Meata |
12 |
7 |
11 |
10 |
13 |
17 |
18 |
| Poultry |
0.7 |
0.3 |
1.7 |
0.4 |
1.7 |
4.8 |
0.9 |
| Egg |
4.8 |
2.9 |
3.7 |
1.9 |
2.4 |
2.3 |
1000 2.3 |
| Fishb |
0.6 |
0.5 |
0.9 |
0.1 |
2.5 |
3.7 |
0.1 |
| Veg oil |
4.7 |
3.5 |
8.4 |
5.8 |
2.6 |
3.8 |
1.8 |
| Ani. fatc |
2.4 |
1.1 |
0.3 |
0.7 |
1.1 |
0.2 |
0.4 |
a,b,c,d: same as table 2
|
| Table 4. Household nutrient
intake in 19904
(6 provinces and Beijing)
| |
BJ
|
HB
|
HL
|
NX
|
ZJ
|
GD
|
SC
|
|
Urban
|
|
|
|
|
|
|
|
1000
|
Energy
(kcal)
|
2166
|
2471
|
2238
|
2197
|
2160
|
2136
|
2286
|
|
% E from
cereals
|
52.3
|
65.4
|
67.7
|
62.7
|
53.5
|
55.4
|
52.0
|
|
% E from
fat
|
29.5
|
20.5
|
23.8
|
26.1
|
24.7
|
25.6
|
30.8
|
|
Protein (g)
|
70.2
|
79.8
|
70.9
1000 |
77.5
|
75.4
|
70.5
|
66.2
|
|
Rural
|
|
|
|
|
|
|
|
|
Energy
(kcal)
|
2309
|
2227
|
2907
|
2402
|
2460
|
2425
|
2335
|
|
% E from
cereals
|
73.2
|
81.9
|
77.4
|
83.4
|
80.2
|
77.6
|
78.2
|
|
% E from
fat
|
18.0
|
13.9
|
17.0
|
12.7
|
12.1
|
14.4
|
14.3
|
|
Protein (g)
|
69.1
|
69.1
|
84.2
|
68.5
|
63.9
|
60.7
|
59.6
|
|
Table 5. Meat and cereal consumption
by income group* in 1990 (urban, 6 provinces and Beijing) (kg/capita/year)
| |
BJ
|
HB
|
HL
|
NX
|
ZJ
|
GD
|
SC
|
| Cereal consumption |
|
|
|
|
|
| Group 1 |
111
|
175
|
186
|
1000
188
|
116
|
124
|
138
|
| Group 2 |
126
|
174
|
180
|
189
|
120
|
126
|
136
|
| Group 3 |
124
|
171
|
164
|
183
|
121
|
129
|
128
|
| Group 4 |
120
|
171
|
170
|
181
|
121
|
123
|
124
|
| Group 5 |
126
|
187
|
165
|
198
|
124
|
121
|
125
|
| Group6 |
120
|
184
|
178
|
202
|
127
|
110
|
126
|
| Meat consumption |
|
|
|
|
|
| Group 1 |
30
|
15
|
12
|
11
|
15
|
22
|
32
|
| Group 2 |
31
|
7
|
15
|
14
|
21
|
1000
24
|
36
|
| Group 3 |
32
|
8
|
14
|
18
|
19
|
26
|
42
|
| Group 4 |
36
|
21
|
22
|
29
|
20
|
27
|
36
|
| Group 5 |
37
|
24
|
20
|
29
|
18
|
28
|
34
|
| Group 6 |
36
|
28
|
20
|
27
|
18
|
29
|
37
|
Group 1: households of the lowest 10 percentile
of income, Group 2: 11-25 percentile, Group 3: 26-50 percentile,
Group 4: 51-75 percentile, Group 5: 76-90 percentile, Group
6: the highest 91-100 percentile.
|
| The DDP scores of the
urban income groups were mostly over 80 (Table 7). This means
the dietary pattern has accomplished over 80% of the Nutritional
Goal for 2000. Beijing was penalized for too much meat intake.
ZJ province received a score of more than 100 due to high soybean
product consumption in addition to a proper amount of animal food
consumption so animal protein plus soybean protein reached 45%
of total protein while the goal for 2000 is 40%.
Income Elasticity and Price Elasticity
The above data indicate the highest 10% income
group does not always have an ideal dietary pattern. It depends
on food choice behavior when income increases. It is necessary
to analyze the Income Elasticity for food items.
Analysis of the household survey data by the
State Statistics Bureau during 1985-1989 shows the income elasticity
of urban populations for animal foods to be fairly high. Poultry
was highest, ranging from 1.0-1.06, 0.82 for milk, 0.79-0.90
for eggs, and 0.58-0.61 for pork. Price elasticity for pork
during the same period was -0.36. Also low in price elasticity
were cereals, sugar, vegetables and vegetable oil. Dynamic analysis
of price elasticity of foods shows a declining trend for price
elasticity of all kinds of animal foods during 1981-1987, which
illustrated the increasing demand and affordability of animal
foods to urban people. It also alerts people to the possibility
of an irreversible upward trend in animal food consumption2,4.
Food demand in the future
Based on a series of indicators related to food
consumption, cities were divided into six categories. Table
8 shows the projections for food consumption for city categories
I to V in the year 2000. The projection was done by applying
the secular changes of food consumption since 1987. If no action
is taken to intervene or guide people's food consumption behavior:
consumption of cereals, sugar and vegetables will decline; poultry
consumption will increase by 2-5 times from 1987; and the demand
for beef, mutton, eggs and milk will increase 1-2 times. These
figures call for the government and public to take timely actions
to avoid over-consumption of animal foods.
Trends in disease patterns
Increase in mortality of nutritionally related
chronic diseases have occurred in China, Figure 3 compares the
share of mortality of stroke, cancer and heart disease in China
and the US during 1930-1980. The slope of the increase in China
was steeper than that of the United States. The standardized
mortality and the 1000 share of total mortality of diseases
in China are shown in Table 9. The sum of mortality of stroke,
cancer and heart disease was 65% of the total mortality in China
in 1986, while it was 67% in the United States in 1985.
|
Table 6. Desirable Dietary
Pattern-- China 2000*
|
Food items consumed
|
% total energy
|
Rating
|
Score
|
Maximum limit of score
|
| Cereals/ tubers |
60
|
0.5
|
30.0
|
40
|
| Animal foods |
14
|
2.5
|
35.0
|
40
|
| Added oil and
fat |
9
|
1.0
|
9.0
|
10
|
| Beans & products |
5
|
2.5
|
12.5
|
18
|
| Sugar |
5
|
0.5
|
2.5
|
|
| Nuts & seeds |
2
|
0.5
|
1.0
|
5
|
| Vegetable &
fruit |
5
|
2.0
|
10.0
|
15
|
| Wine & drinks |
0
|
|
|
|
| Total |
100
|
|
|
|
* (a) Example for calculation of the scores
for food items: % of total energy from the food x rating = score,
(b) Add all scores of food items = total score, (c) When score
for food item exceeds the maximum limit of score, the score
must be counted at the limit:
Example: when % energy of cereal = 85, 85 x 0.5 = 42.5 since
the maximum limit for cereals is 40 the score must be limited
to 40, not 42.5 as calculated.
Table 7. DDP score of urban household
income groups4
|
Income group
|
BJ
|
HB
|
HL
|
NX< 1000 /p>
|
ZJ
|
GD
|
SC
|
|
1
|
93.8
|
79.1
|
72.3
|
77.3
|
100.7
|
93.3
|
96.8
|
|
2
|
94.1
|
83.6
|
78.4
|
82.4
|
107.3
|
96.2
|
96.2
|
|
3
|
93.4
|
86.5
|
80.9
|
86.5
|
107.5
|
97.0
|
96.5
|
|
4
|
94.7
|
89.3
|
82.1
|
90.0
|
106.5
|
96.5
|
95.4
|
|
5
|
95.1
|
89.3
|
83.0
|
91.7
|
107.0
|
96.5
|
95.4
|
|
6
|
93.6
|
90.0
|
85.9
|
92.2
|
105.9
|
96.0
|
94.6
|
|
| Table 8. Projected food consumption
(g per day) of urban residents in China by 20002 |
|
City category
|
| |
I
|
II
|
III
|
I 1000 V
|
V
|
| |
1987
|
2000
|
1987
|
2000
|
1987
|
2000
|
1987
|
2000
|
1987
|
2000
|
| Pork |
19.2
|
32.5
|
14.3
|
14.4
|
13.0
|
15.8
|
18.6
|
17.3
|
24.8
|
25.4
|
| Beef & mutton |
3.1
|
4.8
|
3.2
|
6.8
|
7.8
|
12.3
|
1.8
|
5.3
|
1.7
|
3.6
|
| Poultry |
2.2
|
5.6
|
1.9
|
5.5
|
1.7
|
11.3
|
7.1
|
18.4
|
5.6
|
18.4
|
| Egg |
12.0
|
37.9
|
7.9
|
13.9
|
5.6
|
10.8
|
.4
|
13.3
|
5.9
|
13.1
|
| Milk |
10.8
|
20.8
|
7.1
|
8.0
|
11.4
|
23.1
|
12.8
|
58.3
|
6.5
|
14.9
|
| Fish |
5.8
|
7.0
|
5.9
|
6.0
|
4.2
|
7.4
|
11.4
|
8.7
|
6.4
|
7.2
|
| Cereal |
137.8
|
111.9
|
109.6
|
69.2
|
124.3
|
108.7
|
123.8
|
99.5
|
118.1
|
91.5
|
| Vegetable |
150.6
|
163.0
|
162.5
|
131.0
|
142.9
|
136.2
|
107.8
|
70.5
|
135.5
|
132.7
|
| Veg. oil |
7.7
|
12.9
|
5.8
|
10.9
|
8.2
|
15.5
|
8.0
|
11.4
|
6.8
|
12.5
|
Table 9. Comparison of standardized
mortality of major cause of death (/ 100,000)8
| |
Stroke
|
Cancer
|
Heart disease
|
Accident
|
Others
|
| Mortality |
|
|
|
|
|
| China -1986 |
123.9
|
109.5
|
176.4
|
54.5
|
140.0
|
| USA-1985 |
32.3
|
132.5
|
200.3
|
34.3
|
133.4
|
| % share of mortality |
|
|
|
|
| China-1986 |
20
|
17
|
28
|
9
|
24
|
| USA-1985 |
6
|
24
|
37
|
6
|
24
|
The survey of 9872 urban households in Beijing
and six provinces in 1990, shows the prevalences of hypertension,
coronary heart disease and cerebrovascular disease in all the
provinces and Beijing in 1990 tend to be higher than the national
average in 1986 (Table 10).
The projections for chronic disease based on
demographic change, risk factor and disease estimations indicate
that by the year 2030 in China, there will be annually 800,000
deaths by coronary heart disease, 3 million from strokes and
1.7 million due to lung cancer. If an appropriate prevention
strategy is adopted, shifting from treatment-focused to prevention-focused
care, one third to half of the deaths could be avoided as well
as many premature deaths8. Nutrition and diet is
certainly within the reach of the risk factor family.
|
Table 10. Comparison of prevalence
for chronic diseases in 1990 with 1986 (per thousand)4
| |
Hypertension
|
Coronary heart disease
|
Stroke
|
|
1986 survey
|
48.90
|
16.01
|
7.00
|
|
1990 survey
|
|
|
|
|
BJ
|
99.96
|
< 1000 p align="center">80.13
|
20.23
|
|
HB
|
62.92
|
42.66
|
17.86
|
|
HL
|
55.70
|
53.30
|
20.89
|
|
NX
|
30.74
|
26.22
|
5.42
|
|
ZJ
|
60.22
|
41.57
|
7.78
|
|
GD
|
40.96
|
14.47
|
13.00
|
|
SC
|
48.56
|
22.45
|
16.84
|
|
| Figure 3.
China and US mortality rate and share (%) of death from heart
disease, cancer and stroke8 |
 |
| An analysis of food
consumption in Shanghai during 1950-1982 revealed the mortality
rate of heart disease, cerebrovascular disease and cancer were
positively correlated with meat, egg and sugar consumption and
negatively correlated with cereal consumption (Table 11). Although
disease pattern change is related to a series of factors, in the
light of people's recognition of the idea of a healthy diet and
the cost-effectiveness of nutrition intervention, the role nutrition
plays in health promotion and disease prevention should not be
underestimated.
The future
All of the evidence should alert people and
government that timely food production planning, with formulation
of nutrition policy, and orientation of food consumption behavior
of people is required.
|
Table 11. Food consumption
in relation to disease mortality2
| |
Correlation coefficient
|
| |
Heart disease
|
Cerebrovascular disease
|
Cancer
|
| Cereals |
-0.7009
|
-0.4542
|
-0.6067
|
| Meat |
0.9008
|
0.8236
|
0.7461
|
| Egg |
0.7892
|
0.4996
|
0.4929
|
| Sugar |
0.9359
|
0.8640
|
0.7891
|
|
Recommendations for food production were made and
a "China National Program of Food Structure Reform and Development
in l990s" was announced in 1993. Its aim is to plan economically
sustainable food production for adequate and healthy nutrition. The
Program substantially incorporates nutritional considerations and
goals for the year 2000 into future production plans. Some of the
aims are:
- to maintain the dietary pattern of Chinese people
as a principally vegetable diet with moderate amounts of animal
foods;
- to meet the nutrient requirements in terms of food
items;
- to lower pork intake from the current 84% to 70%
of meat production; to raise the poultry ratio to 20%;
- to encourage soybean production to avoid improper
increases of animal food consumption for upgrading protein quality;
and
- to promote vegetable and fruit production.
Public nutrition education will be extremely important
in promoting the self-protection/ disease prevention capacity of nutritional
improvement. The joining of actions by the community and government
at all levels and by food industries in China, are at a crossroad.
Either food products of good nutritional quality to promote a balanced
diet or adulterated food products to devastate the dietary pattern.
For all parties it is an issue of social responsibility for long-term
rather than simply short-term benefit. Close collaboration between
the community, government, science and industry in product development
should be stressed.
Eating patterns-- a prognosis
for China
Chen CM
Asia Pacific J Clin Nutr (1995)
4, Suppl 1
References
- WHO Technical Report Series No. 797, 1990 (Diet,
nutrition and the prevention of chronic diseases: report of a WHO
Study Group)
- MLFDS Study Group. The medium and long-term food
development strategy of China. pp 93-98, 490-495, 112, Beijing,
Agriculture Publishing House, 1993
- 1993 Year Book of Statistics of China. China Statistics
Publishing House, 1993
- Chen CM, Shao ZM. Food, nutrition and health status
of Chinese in seven provinces 1990. pp 21-46, 158, Beijing, China
Statistical Publishing House, 1994
- Chen CM. The national nutrition survey in China,
Summary of the result. Food and Nutrition, FAO 1985; 12: 58-60.
- Chen CM. Dietary guidelines for food and agriculture
planning in China, Proc. of international symposium on food, nutrition
and social economic development, Beijing, China Science and Technology
Publishing House, 1991, p 40
- FAO/RAPA, Towards nutritional adequacy in Asian-Pacific
region, RAPA Report 1989/4, 1989, p 56
- A World Bank country study. China - Long-term issues
and options in the health transition. The World Bank, Washington
D.C. 1992: 47
Copyright © 1995 [Asia Pacific Journal of Clinical
Nutrition]. All rights reserved.
Revised:
January 19, 1999
.
 to the top to the top
0
|