Asia Pacific J Clin Nutr (1995) 4,2: 220-224
Asia Pacific J Clin Nutr (1995) 4,2: 220-224

Use of food intake and body mass
index (BMI) in the assessment of adult nutritional status in Viet
Nam including a maternal-child analysis
Ha Huy Khoi, Tu Giay
National Institute of Nutrition, Hanoi,
Viet Nam
The authors have used food intake and Body Mass
Index (BMI) to assess Vietnamese adult nutritional status. Chronic
Energy Deficiency (CED) is prevalent in Vietnamese adults with an
average percentage about 40%. The mean value of BMI in the 26-40
year old age group is 19.7 but it decreases thereafter except in
urban areas. The change in the BMI curve distribution varies among
adults living in rural, urban and mountainous areas. There seems
to be a relationship between the BMI of mothers and the nutritional
status of their children underthe age of 5. Some findings revealed
a relationship between maternal BMI and birth weight and between
CED and health status. The proposed cut-off point of Ferro-Luzzi-James
in the classification of CED was applied to data from Vietnam.
Introduction:
There are some common indices, such as Broca and Lorentz,
used to assess the nutritional status of adults. The calculated values
for these weight-stature indices differ although they are highly correlated.
Comparison between available data is difficult when different indices
are used. Recently, to assess the nutritional status of adults, WHO/
FAO has recommended the use of the Body Mass Index (BMI) [Weight
(kg)/ height (m)2] calculated and classified
as follows1:
In a report by a Working Party of the International
Dietary Energy Consultative Group2, new criteria were proposed
for classifying Chronic Energy Deficiency (CED) in adults, involving
measuring BMI, energy intake (or expenditure) and basal metabolic
rate (BMR).
Recently a simplified approach using BMI alone has
been proposed to assess adult CED3. In this approach, a
BMI greater than 18.5 is classified as normal, from 17-18.4 is grade
I CED, from 16-16.9 is grade II CED and below 16.0 is grade III CED.
In this paper, we present the use of BMI as an indicator of adult
nutritional status within this population. The results were collected
from various surveys and studies.
Prevalence of CED in Vietnam.
Study 1: During the period 1981-1985,
the weights and heights of 12,800 rural adults were recorded in different
age groups and ecological regions. The results of Study 1 are presented
in Tables 1 and 2 and show that:
- BMI mean values decrease after 40 years in each
gender
- CED is quite prevalent in Vietnam
- the average percentage of adults having BMI less
than 18.5 is about 40%
- the highest percentage was shown in the oldest
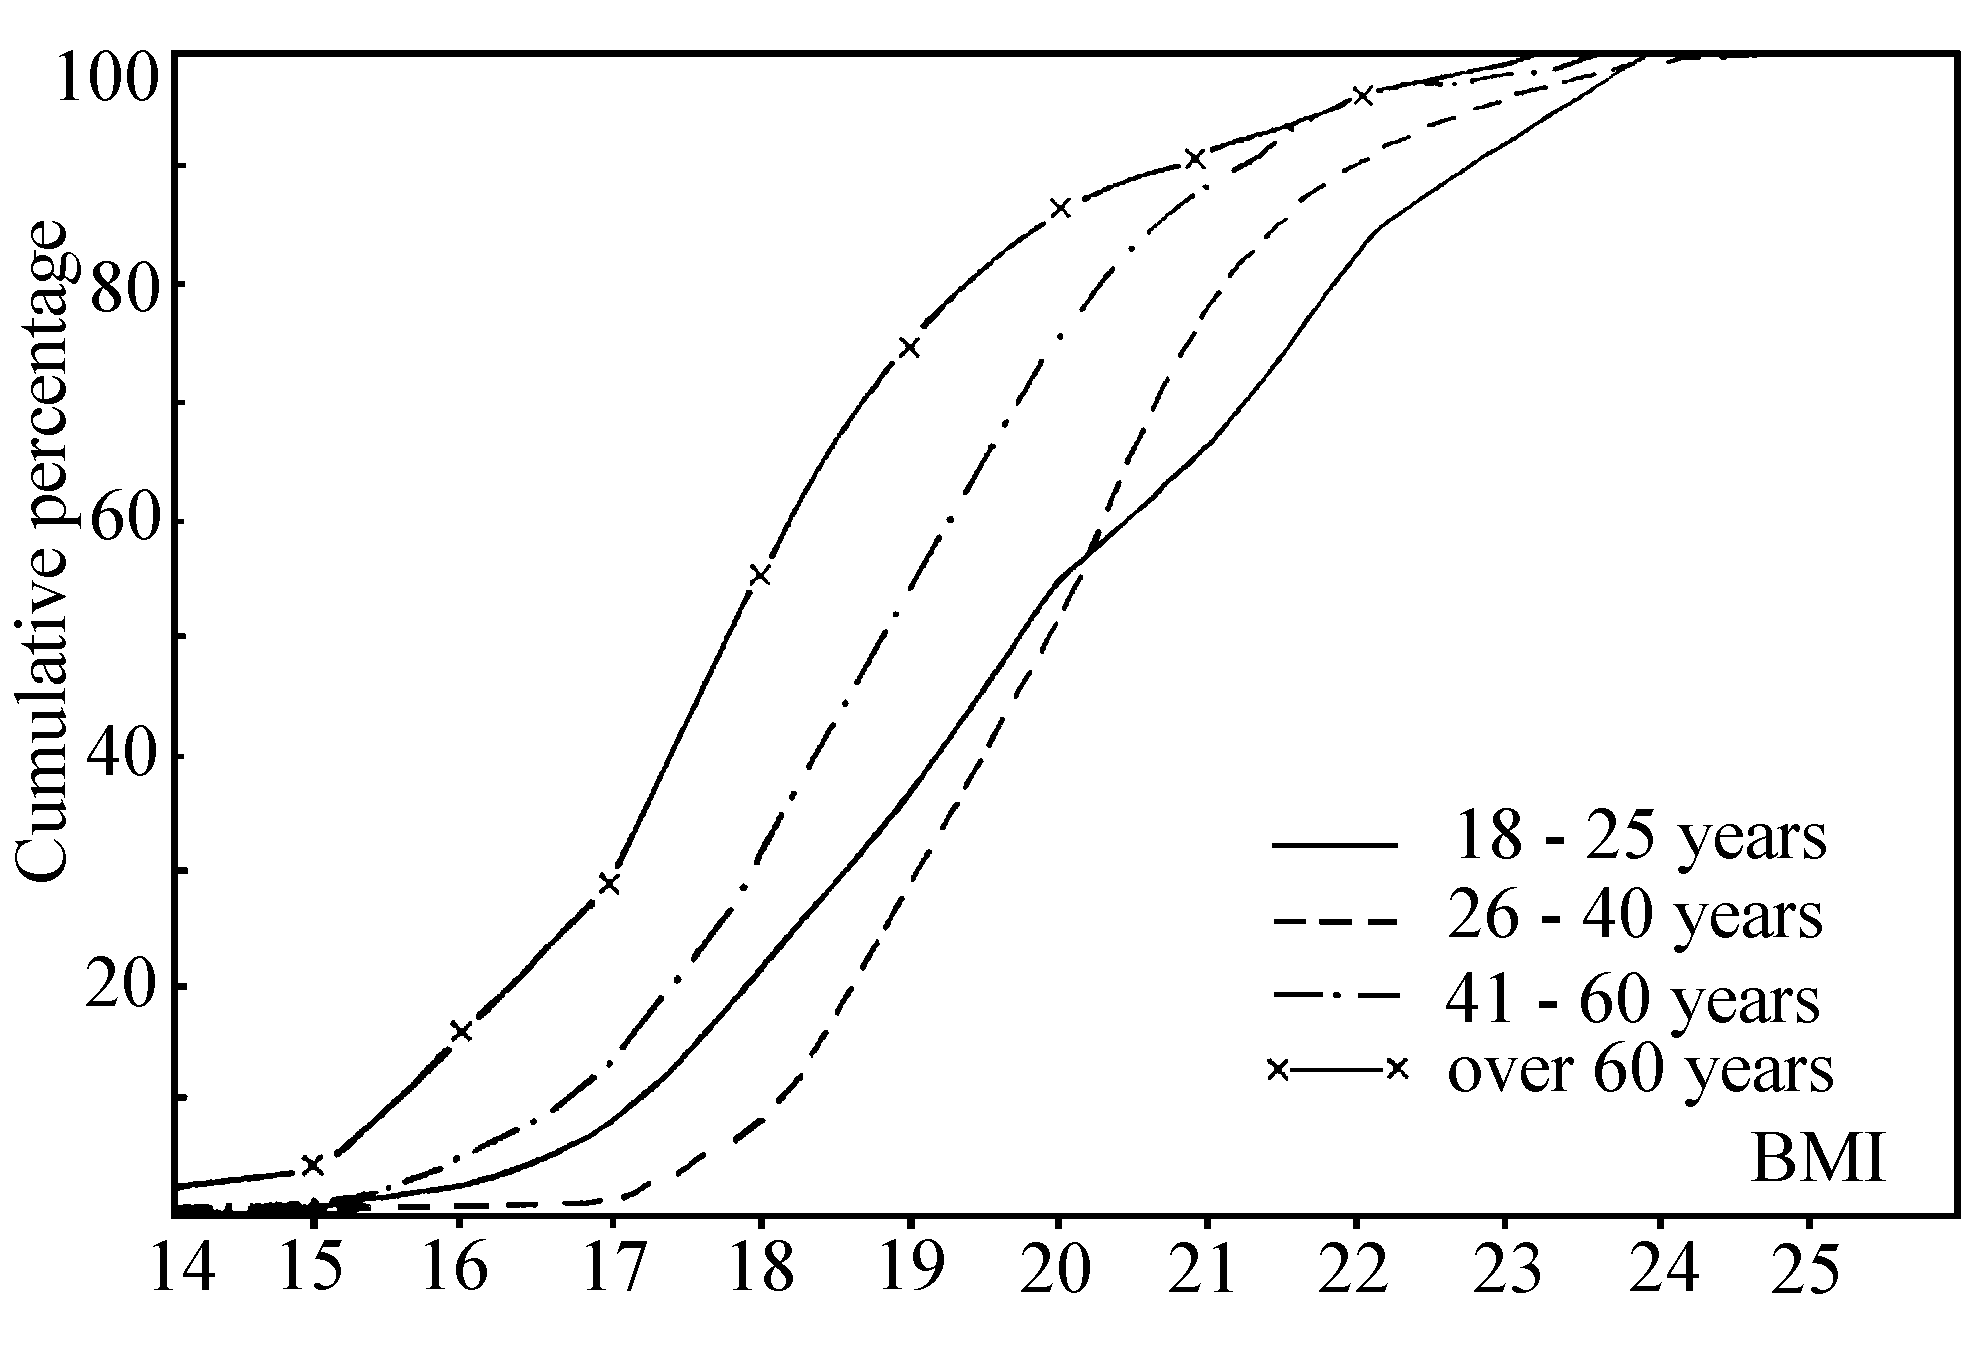
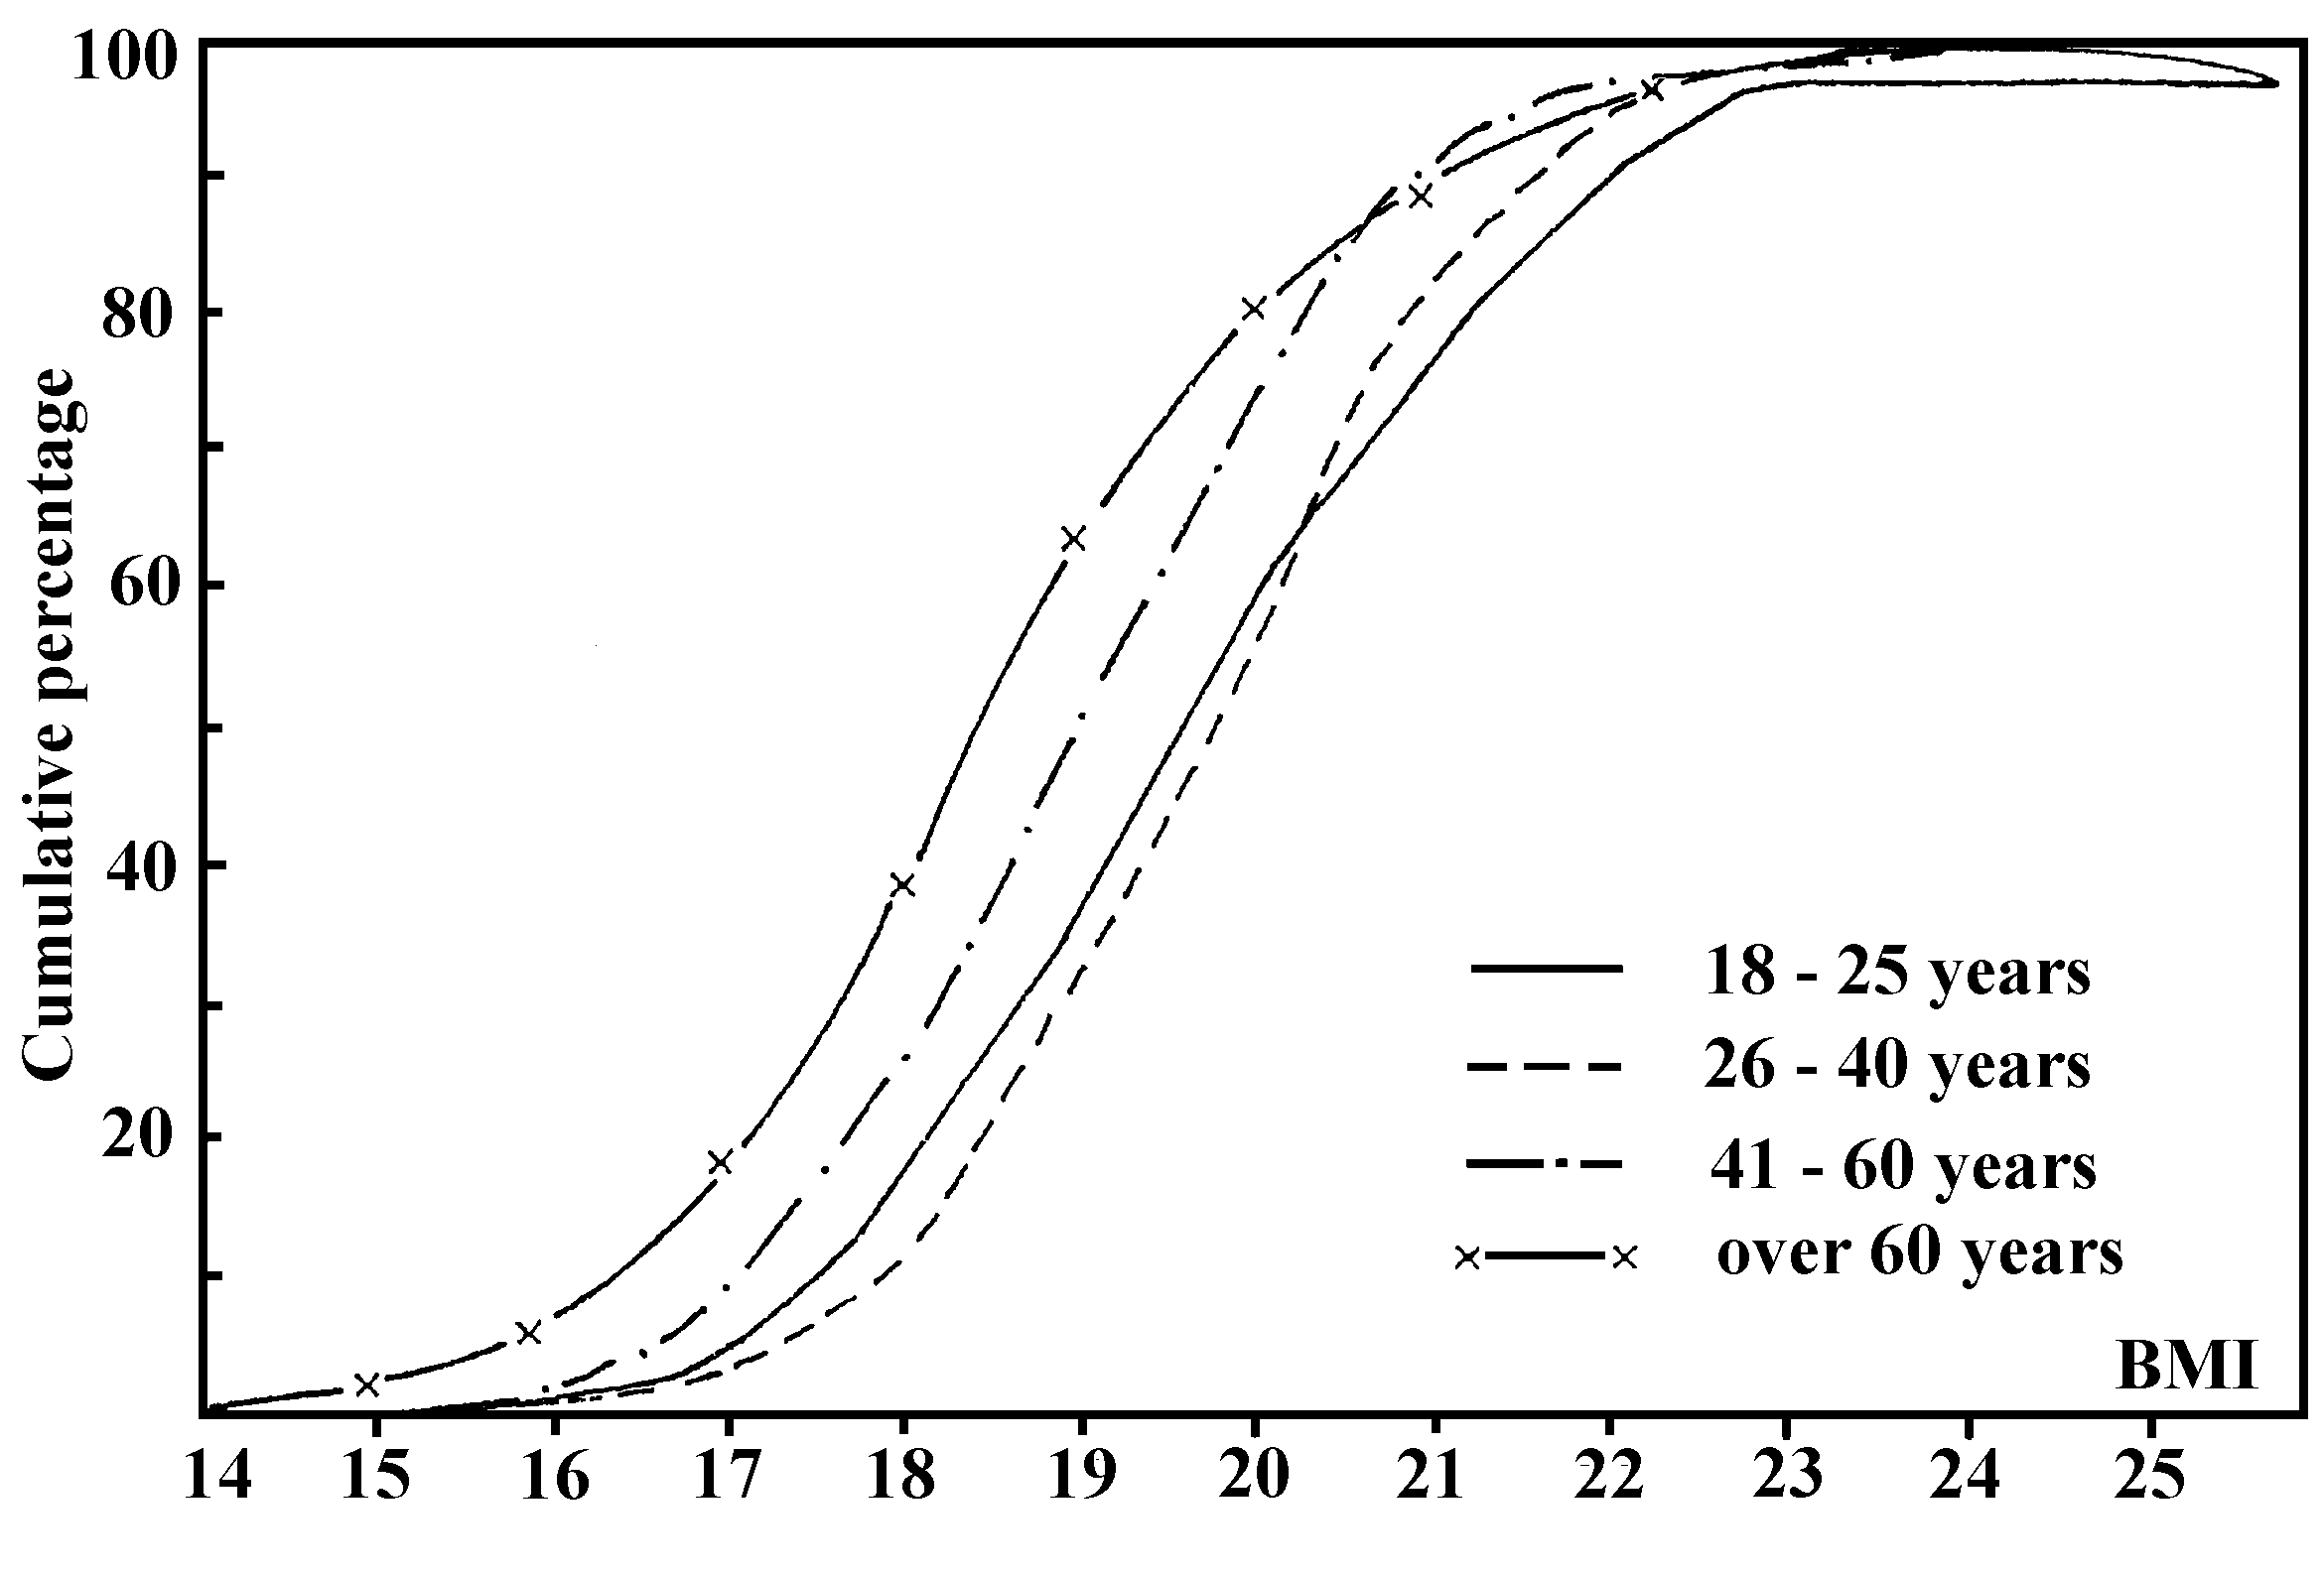
age group of both genders ( Figures 1 and 2 ).
-
| BMI |
MEN
|
WOMEN
|
| Low |
< 20.0
|
< 18.6
|
| Desirable range |
20.1-25.0
|
18.7-23.8
1000 |
| Overweight |
25.1-30.0
|
23.9-8.6
|
| Obese |
> 30.0
|
> 28.6
|
Table 1. Mean ± SD value of BMI (kg/m2)
of adults
| Age Group |
Males
|
Females
|
| 18-25 |
19.2 ± 1.9
|
19.8 ± 1.9
|
| 26-40 |
19.7 ± 1.7
|
19.7 ± 1.8
|
| 41-60 |
19.0 ± 1.8
|
18.6 ± 2.0
|
| > 60 |
18.2 ± 2.2
|
17.8 ± 2.2
|
Table 2. Classification of nutritional
status (%) using BMI as indicator
| Age groups |
BMI groups |
< 16
|
16.0-16.9
|
17.0-18.4
|
Total
< 18.5
|
| 18-25 |
Male |
1.2
|
2.4
|
22.4
|
26.0
|
| |
Female |
2.7
|
5.3
|
20.5
|
28.5
|
| 26-40 |
Male |
0.8
|
2.5
|
18.3
|
21.6
|
| |
Female |
0.4
|
0.8
|
16.6
|
17.8
|
| 41-60 |
Male |
1.4
|
7.9
|
28.4
|
37.7
|
| |
Female |
5.0
|
7.7
|
29.7
|
42.4
|
| >60 |
Male |
5.8
|
12.6
|
32.6
|
51.0
|
| |
Female |
15.8
|
12.6
|
36.8
|
65.2
|
|
Figure 1 Frequency distribution of Body Mass
Index (BMI) in women

Figure 2 Frequency distribution of BMI in males

Study 2: From 1987-1989 we carried out
a general nutrition survey of a sample of 12,789 households in different
regions of the country including Hanoi and Ho Chi Minh City. The survey
findings of Study 2 consist of: measurement of household food composition
during 3 consecutive days for household members and the recording
of socioeconomic factors5.
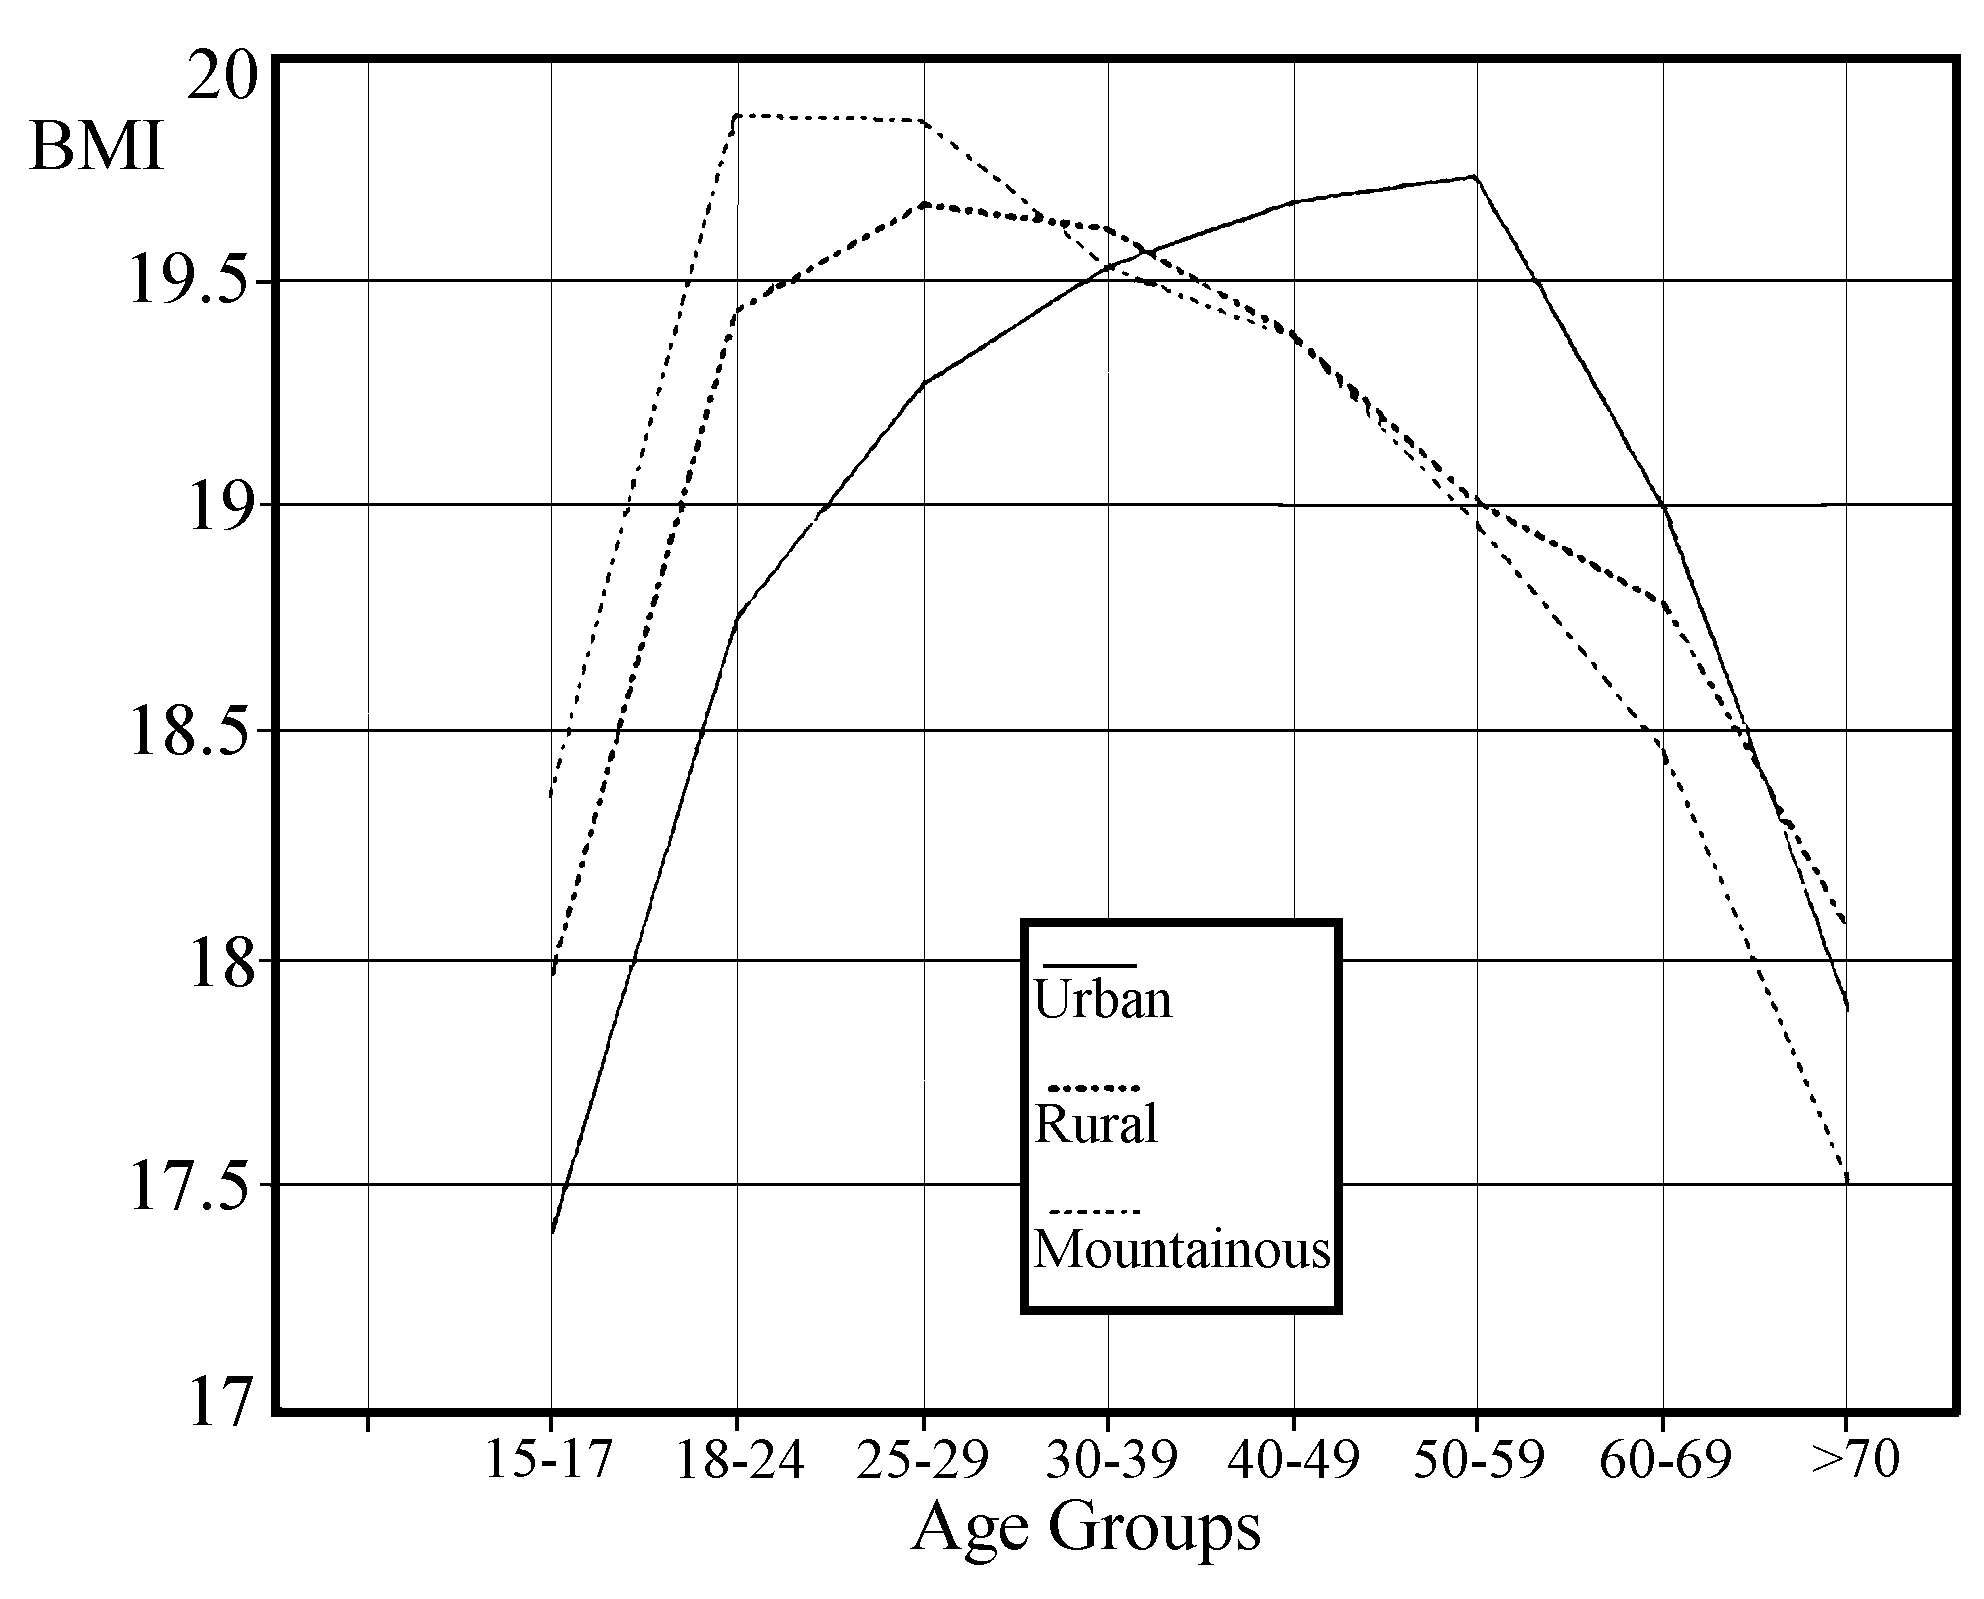
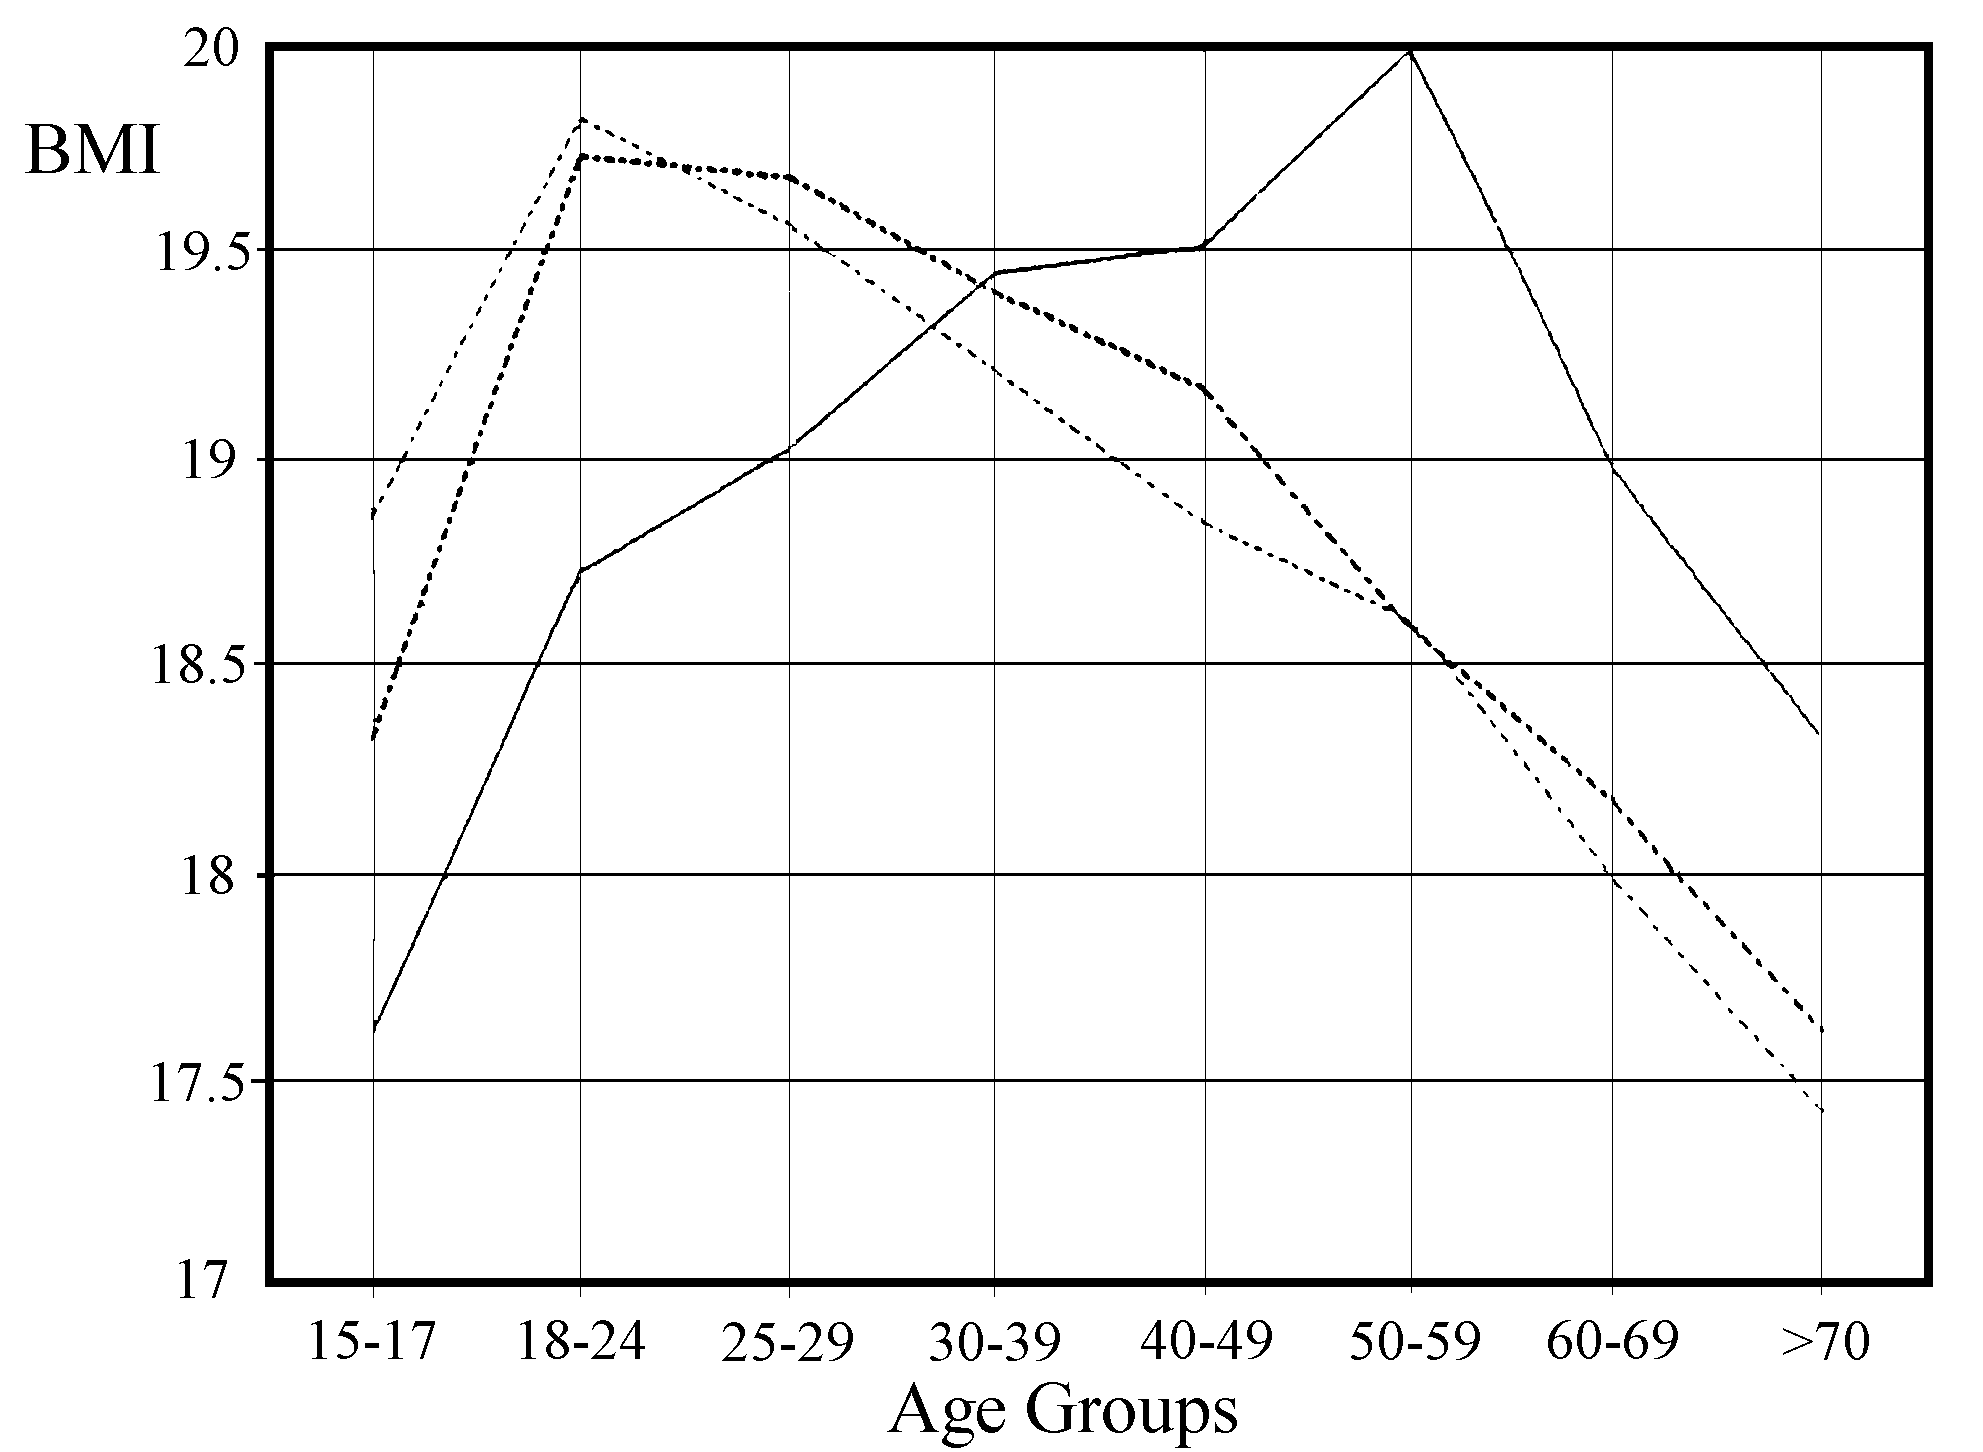
The survey results (Tables 3 to 7 and Figures 3 and
4) show that the pattern of change in BMI is similar in rural and
mountainous areas but is different in urban areas. In the first two
groups, the BMI mean values were highest at the age of 25-29 years
for males and 18-24 years for females; they were lower in the urban
group during these ages. The urban BMI mean values increased up to
the age group of 50-59 years and decreased thereafter. This fact may
be due to differences in food intake, energy expen-diture and lifestyle
of the populations in these regions.
Table 3. Food consumption (grammes per capita
per day) (mean ± SD)
| Foodstuffs |
Urban (n = 1655)
|
Rural (n = 9135)
|
Mountainous (n = 1634)
|
-
- Rice-- cooked
|
421.3 ± 112.3
|
457.1 ± 133.9
|
498.0 ± 129.2
|
| Other cereals |
14.2 ± 30.2
|
3.7 ± 26.7
|
7.4 ± 33.6
|
| Tubers |
11.8 ± 33.2
|
47.5 ± 118.9
|
38.8 ± 119.9
|
| Beans & Peas |
2.4 ± 10.2
|
1.6 ± 10.1
|
4.0 ± 20.5
|
| Tofu |
16.5 ± 33.7
|
4.9 ± 18.8
|
8.7 ± 24.2
|
| Nut & Sesame |
4.2 ± 10.6
|
3.0 ± 13.0
|
9.4 ± 20.8
|
| Veg. leaves |
108.5 ± 77.3
|
145.2 ± 113.9
|
169.0 ± 106.3
|
| Veg. tubers |
39.4 ± 49.2
|
49.4 ± 87.3
|
68.5 ± 78.7
|
| Fruits |
10.2 ± 33.8
|
1000
1.2 ± 13.1
|
0.2 ± 3.7
|
| Sugar |
1.8 ± 6.9
|
0.3 ± 2.8
|
0.1 ± 1.2
|
| Sauces |
22.3 ± 25.8
|
30.2 ± 31.7
|
23.5 ± 34.8
|
| Oil & Fat |
6.4 ± 9.8
|
2.6 ± 6.6
|
2.7 ± 8.3
|
| Meats |
49.3 ± 50.2
|
13.7 ± 31.1
|
28.5 ± 40.9
|
| Eggs & milk |
9.6 ± 18.6
|
1.4 ± 6.6
|
2.0 ± 11.2
|
| Fish |
62.2 ± 81.1
|
29.3 ± 40.8
|
8.1 ± 18.1
|
| Other aquatics |
7.8 ± 16.4
|
8.8 ± 21.1
|
1.8 ± 8.3
|
Table 4. Nutritive value of dietary intake
(per capita per day) (mean ± SD)
| Nutients |
Urban (n = 1655)
|
Rural (n = 9153)
|
Mountainous (n = 1634)
|
Protein (g)
-Animal protein |
62.5 ± 19.8
22.7 ± 14.6
|
53.9 ± 18.6
11.2 ± 12.4
|
57.7 ± 18.3
7.8 ± 9.9
|
Lipids (g)
-Vegetable lipids |
28.7 ± 17.5
7.0 ± 7.8
|
13.9 ± 12.4
6.6 ± 6.6
|
18.8 ± 15.5
10.3 ± 9.6
|
| Carbohydrate (g) |
336.2 ± 85.4
|
375.4 ± 102.2
|
411.1 ± 93.7
|
| Energy (KCal) |
1905.2 ± 485.2
|
1892.8 ± 524.4
|
2101.5 ± 498.2
|
| Calcium (mg) |
464.6 ± 266.7
|
553.0 ± 471.9
|
408.3 ± 216.6
|
| P (mg) |
789.0 ± 229.3
|
702.5 ± 223.2
|
758.8 ± 229.8
|
| Fe (mg) |
9.8 ± 2.8
|
9.5 ± 3.1
|
10.3 ± 3.5
|
| Vitamin A (mg) |
0.1 ± 0.4
|
0.0 ± 0.1
|
0.0 ± 0.1
|
| Carotene (mg) |
2.1 ± 1.9
|
2.8 ± 3.1
|
2.6 ± 2.7
|
| Vitamin B1 (mg) |
1000
0.8 ± 0.3
|
0.7 ± 0.3
|
0.8 ± 0.3
|
| Vitamin B2 (mg) |
0.5 ± 0.3
|
0.3 ± 0.2
|
0.4 ± 0.2
|
| Nicotinic Acid (mg) |
10.7 ± 3.8
|
9.7 ± 3.5
|
11.4 ± 4.8
|
| Vitamin C (mg) |
48.7 ± 44.0
|
61.2 ± 59.4
|
73.7 ± 55.8
|
Table 5. Balanced characteristics of the dietary
intake
| Nutrients |
Urban
n = 1655
|
Rural
n = 9153
|
Mountain
n = 1634
|
| Energy (Kcal) |
1905.2 ± 485.2
|
1892.8 ± 524.4
|
2101.5 ± 498.2
|
| Protein
energy (%) |
13.5%
|
11.7%
|
11.3%
|
| Lipid energy (%) |
14.0%
|
6.8%
|
8.3%
|
| Carbohydrate energy
(%) |
72.3%
|
81.3%
|
80.2%
|
| Animal Protein/ Total
Protein (%) |
36.3%
|
20.9%
|
13.6%
|
| Veg Lipid/ Total Lipid
(%) |
24.4%
|
47.9%
|
54.8%
|
| Ca/ P |
0.59
|
0.79
|
0.54
|
| B1 (mg)/ 1000 Kcal |
0.49
|
0.37
|
0.43
|
Table 6. BMI of males by age group
|
Age group
|
For all
|
Urban
|
Rural
|
Mountainous
|
|
15-17
|
17.919 ± 2.811
n = 2236
|
17.402 ± 2.007
n = 394
|
17.962 ± 3.114
n = 1488
|
18.357 ± 2.05
n = 333
|
|
18-24
|
19.397 ± 1.943
n = 3006
|
18.755 ± 2.118
n = 483
|
19.435 ± 1.904
n = 1975
|
19.877 ± 1.722
n = 520
|
|
25-29
|
19.682 ± 1.791
n = 2322
|
19.271 ± 1.911
n = 239
|
19.678 ± 1.719
n = 1653
|
19.87 ± 1.943
n = 400
|
|
30-39
|
19.603 ± 1.914
n = 3213
|
19.539 ± 2.087
n = 363
|
19.623 ± 1.892
n = 2347
|
19.54 ± 1.91
n = 459
|
|
40-49
|
19.476 ± 2.698
n = 1908
|
19.683 ± 4.129
n = 515
|
19.385 ± 1.897
n = 1142
|
19.372 ± 1.947
n = 224
|
|
50-59
|
19.129 ± 2.022
n = 1989
|
19.739 ± 2.337
n = 368
|
19.004 ± 1.943
n = 1341
|
18.956 ± 1.771
n = 265
|
|
60-69
|
18.75 ± 3.063
n = 1338
|
18.992 ± 2.412
n = 154
|
18.774 ± 3.37
n = 949
|
18.448 ± 1.864
n = 226
|
|
>70
|
17.942 ± 2.277
n = 711
|
17.887 ± 2.422
n = 95
|
18.059 ± 2.154
n = 495
|
17.504 ± 2.594
n = 119
|
Table 7. BMI of females by age
groups
|
Age group
|
For all
|
Urban
|
Rural
|
Mountainous
|
|
15-17
|
18.261 ± 2.263
n = 2303
|
17.623 ± 2.002
n = 461
|
18.328 ± 2.36
n = 1501
|
18.861 ± 1.942
n = 331
|
|
18-24
|
19.609 ± 1.987
n = 4312
|
18.726 ± 1.957
n = 605
|
19.724 ± 1.964
n = 3031
|
19.823 ± 1.903
n = 636
|
|
25-29
|
19.599 ± 1.888
n = 2856
|
19.023 ± 2.015
n = 337
|
19.675 ± 1.857
n = 2086
|
19.561 ± 1.811
n = 381
|
|
30-39
|
19.363 ± 1.98
n = 3921
|
19.446 ± 2.204
n = 611
|
19.395 ± 1.927
n = 2781
|
19.206 ± 1.909
n = 469
|
|
40-49
|
19.22 ± 2.069
n = 2320
|
19.503 ± 2.227
n = 590
|
19.164 ± 1.933
n = 1446
|
18.841 ± 2.329
n = 261
|
|
50-59
|
18.691 ± 2.165
n = 2271
|
19.988 ± 2.556
n = 278
|
18.585 ± 2.069
n = 1691
|
18.605 ± 2.234
n = 294
|
|
60-69
|
18.244 ± 2.266
n = 1591
|
18.975 ± 2.624
n = 199
|
18.164 ± 2.153
n = 1166
|
17.983 ± 2.375
n = 219
|
|
>70
|
17.695 ± 2.335
n = 920
|
18.314 ± 2.726
n = 142
|
17.605 ± 2.276
n = 639
|
17.412 ± 2.044
n = 134
|
Figure 3. BMI of males by age group

As shown in Tables 3, 4, and 5, there are not significant
differences in total caloric intake but the percentage of lipid energy
to total energy and animal protein to total protein is higher in urban
populations than in the other groups. In general, rice is the main
cereal of the diet, the intake of other cereals, tubers, beans and
nuts rich in lipid is low. The consumption of animal food as meat,
fish, eggs and fat is higher in urban areas than in rural and mountainous
areas (Tables 3 and 4). It should be mentioned that the average height
and weight of urban residents is generally higher than that of rural
and mountainous areas.
Figure 4. BMI of females by age group

| BMI index of mothers
and nutritional status of children younger than 5 years.
Data from Study 2 were analysed to establish
the relationship between the BMI index of mothers and the nutritional
status of their young children within different categories of
BMI. There is a significant relationship between the two parameters
(Table 8). Weight for age was used to assess nutritional status
with the data from National Center for Health Statistics of
United States (NCHS) as reference population6,9 and
classified as the first degree when below -2 SD, the 2nd degree
when below -3 SD and the 3rd degree when below -4 SD of NCHS
value.
The relationship between the BMI of women and
the economic status of their families was not significant. The
economic status of families was classified into 3 categories
(low, middle, high) according to data relating to their main
properties-- house and precious goods, because accurate incomes
are difficult to collect.
Effect of low BMI on health status
In study 3, carried out on 1990, we followed
the change in food i 1000 ntake and mothers’ weight gain
during pregnancy, and recorded some biochemical indicators of
nutritional status of the newborns including weight. The result
of study 36 indicated that the average gain in weight
of mothers during pregnancy in rural areas is 6.4kg and in Hanoi
City 8.5kg. The study also revealed a significant relationship
between the weight of the new born and the pre-pregnancy BMI
values of the mothers (Table 9).
|
Table 8. Relation between
BMI of mothersand nutritional status of children younger than
5 years
|
Classification BMI
|
Normal
|
CED I
|
CED II
|
CED III
|
Total
|
|
Weight by age
|
|
|
|
|
|
|
Normal %
|
53.20
|
48.10
|
44.00
|
44.30
|
51.40
|
|
N
|
1162
|
324
|
77
|
35
|
1598
|
|
1st degree %
|
32.40
|
33.60
|
35.40
|
29.10
|
32.70
|
|
N
|
707
|
226
|
62
|
23
|
1018
|
|
2nd degree %
|
12.90
|
16.30
|
17.70
|
24.10
|
14.20
|
|
N
|
281
|
110
|
31
|
19
|
441
|
|
3rd degree %
|
1.60
|
1.90
|
2.90
|
2.50
|
1.70
|
|
N
|
34
|
13
|
5
|
2
|
54
|
|
Total %
|
70.20
|
21.60
|
5.60
|
2.50
|
|
|
N
|
2184
|
673
|
175
|
79
|
3111
|
|
Table 9. Relation between
weight gained during pregnancy and birth weight for mothers grouped
by pre-pregnancy BMI
|
Weight gained during pregnancy
|
Newborn weight (g) by mothers’
BMI levels
|
P
|
|
|
< 18.5
|
> 18.5
|
|
|
< 8kg
|
2770
n = 2
|
|