1000
Asia Pacific J Clin Nutr (1995) 4: 173-175
Asia Pacific J Clin Nutr (1995) 4: 173-175

Dual-energy X-ray absorptiometry
vs underwater weighing comparison of strengths and weaknesses
R. H. Nord and R. K. Payne
Norland Corporation, Fort Atkinson,
Wisconsin, USA.
This paper discusses a number of strengths and weaknesses
of two methods for determination of body fat, Dual-energy X-ray
Absorptiometry (DXA) and underwater weighing (UWW). Several error
sources are theoretically quantified. One source of error in the
UWW method, variation in bone mass fraction, is examined using data
gathered on 219 human subjects who were measured by both methods.
The experimental data show the expected linear form but do not exactly
match the theoretical curves, indicating that all error sources
are not completely understood. The data suggest a possible error
in the Brozek equation which is commonly used to compute % fat in
UWW.
Introduction
Underwater weighing (UWW) has been an accepted method
of determining the fat content of the human body for many years. Dual-energy
X-ray absorptiometry (DXA) is a relatively new method for determining
the bone mineral content and also the fat content of the body. Each
of these techniques has its own inherent strengths and weaknesses,
due to the quite different physics behind them. Table 1 lists the
strengths and weaknesses of the two methods in a number of areas.
In areas where it is possible to theoretically quantify the errors
to which each method is subject, plots comparing these errors are
provided.
Table 1. Strengths and weaknesses of two methods
for in vivo determination of body fat percent.
| Method |
Strengths |
Weaknesses |
| Underwater Weighing
|
Insensitive to fat distribution
No radiation exposure |
Accurate estimate of
body gas required.
Affected by abnormal hydration.
Affected by non-standard bone mass.
No absolute verification of accuracy. |
| DXA. |
Insensitive to body
gas.
Insensitive to hydration state.
Useable on nearly all subjects. |
Affected by varying
fat distribution
Slight radiation exposure.
No absolute verification of accuracy. |
Sensitivity to body gas
Gases contained within the body contribute to buoyancy,
and their effect must be compensated in order to obtain an accurate
measure of the density of body tissues in UWW. Residual lung volume
(RLV) must be measured, while abdominal gas is normally simply estimated.
Any error made in measuring or estimating these gas volume will affect
the corrected body density value and will thus result in an error
in %FAT.
The X-ray beam in DXA is unaffected by gases, whether
inside the body or outside, so there is no sensitivity to body gases.
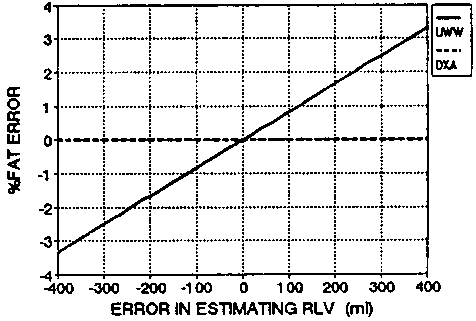
Figure 1 shows the sensitivity of UWW to errors in determining RLV
in a typical subject (55 kg, 35% fat, 2000 ml RLV).
Figure 1. Theoretical error in percent fat
as a function of error in estimating residual lung volume (for typical
subject of 55 kg, 35% fat, 2000 ml RLV).

Sensitivity
to hydration state
Although water is a major constituent of the lean
(nonfat) compartment, both UWW and DXA assume it to be present as
a fixed fraction of the lean mass. Deviations from this fixed fraction
confound both measurements, but to different extents. UWW evaluates
a material by its mass density. In the Brozek equation1,
fat is assumed to have a density of 0.889 g cm3 and nonfat
or lean 1.103 g/cm3. Any intermediate density is evaluated
as a combination of the two. Water, with a density of 1.0 g/cm3,
is evaluated as 43% fat.
DXA evaluates a material by its X-ray attenuation
properties. It is not possible here to enumerate those properties,
but the fact is that pure water looks like 9% fat to DXA2.
However, water is never present in large quantities in the body in
pure form; it exists as serum, lymph, or interstitial fluid, and as
such contains various salts in solution. It is the presence of high
atomic number elements such as sodium, chlorine, potassium, etc, which
make lean tissue 'look lean' to the DXA system. Using published concentrations
for interstitial fluid3, we calculated that water in such
form would look like-2% fat to DXA.
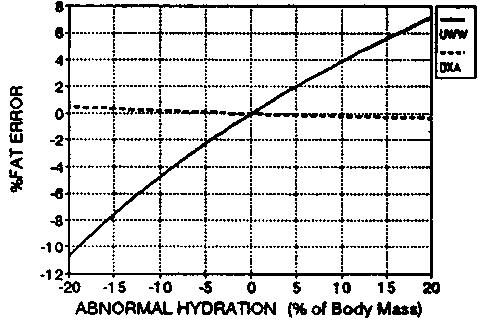
Figure 2. Theoretical error in percent fat
as a function of hydration state of subject (for typical subject of
55 kg, 35% fat).

Figure 2 shows the relative effects of adding or subtracting
water, as interstitial fluid, to or from a typical subject of 35%
fat. The fluid, which belongs in the lean compartment, appears to
add or subtract an amount of fat, as described above, producing an
error in the %FAT value which can be calculated.
Sensitivity
to bone mass
The standard equations used in UWW assume that bone
mineral, which has a relatively high density, will be a fixed fraction
of the lean compartment. Any deviation from this fraction in an individual
will result in an error. Since DXA is able to measure bone mineral
mass independently, there is no similar error in DXA.
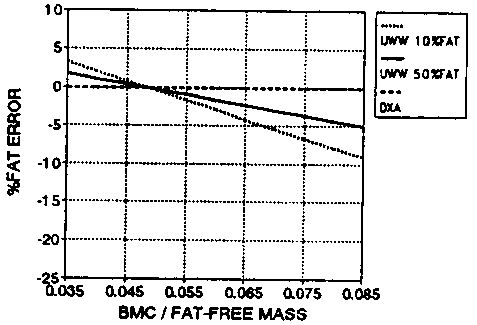
We estimated the bone mass fraction error by calculating
the change in body density which would occur in a test subject if
a certain amount of lean soft tissue were replaced by an equal mass
of bone mineral of higher density. Figure 3 shows the resulting error
in computed %FAT for typical subjects. The UWW %FAT error is zero
at 4.8% because that is the ratio of bone mineral content to fat-free
mass (BMC FFM) assumed by Brozek1.
Sensitivity
to fat 1000 distribution
In the DXA method, it is assumed that a particular
model of fat distribution will adequately represent each subject.
A companion paper discusses the need for such a model4.
If a given subject's actual fat distribution deviates from the assumed
model, there may be an error in computing both bone mineral content
and fat lean composition. The amount of this error is beyond the scope
of this work.
In the UWW method, fat and lean contribute to buoyancy
regardless of their distribution, so there is no similar error.
Radiation
exposure
The DXA measurement requires that the subject receives
a small amount of X-ray exposure. A total body DXA scan will typically
give the X-ray dose of less than 0.1 millirems, regardless of which
manufacturer's instrument is used.
There is no X-ray exposure in UWW.
Applicability
to all subjects
UWW requires that subjects be able and willing to
be completely submerged in water while exhaling rather forcibly. Obviously
the method is ill suited for subjects who are sick, infirm, unconscious
or afraid of water.
DXA requires only that subjects be able to lie still
on the scanner table for a period of about 15 minutes, while breathing
normally.
Verification
of accuracy
A weakness of both methods is the lack of any tests
which verify accuracy absolutely. Such a study would require knowing
the exact fat content of the test subjects, who would have to be live
adult humans. Since the only known way to determine fat content accurately
is by chemical analysis of all body tissues, this study is unlikely
to be done. Use of cadavers, animals, or phantoms all have potential
problems which make them inaccurate or unreliable.
Experimental
results
Experimental checks of the theoretical error estimates
are difficult because of lack of knowledge of the correct body fat
in human subjects and of the magnitude of the confounding factor (such
as hydration state). However in the case of the bone mass fraction
error, the DXA measurement provides a measure of the confounding factor
and also a measure of body fat percent which is expected to be free
of this error. In the process of calibrating Norland's DXA body composition
software, both DXA and UWW measurements were made on a large number
of volunteer subjects. The measurements were made at two sites, the
Body Composition Unit at St Luke's Hospital in New York City5,
and the Department of Sports Medicine at the University of Wisconsin
at Madison6. The DXA scans provide independent measurements
of bone mineral mass (BMC) and non-bone lean mass (LEAN) as well as
fat mass (FAT) from which we could calculate the true bone mass fraction
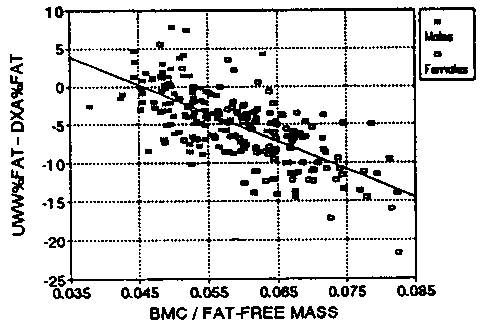
for each subject. The difference between percent fat by UWW and by
DXA for 219 adult subjects is plotted versus the ratio of BMC to fat-free
mass in Figure 4. Compare this plot with the theoretical plot of Figure
3.
Figure 3. Theoretical error in percent fat
as a function of bone mass fraction of total nonfat mass (for typica1
subject of 55 kg).

The experimental data are essentially linear in distribution,
and the regression line crosses the zero error axis at approximately
the expected value of BMC/FFM, the 4.8% used in the development of
the Brozek equation1. The fact that the slope of the regression
b52 line is greater than expected may be an indication of yet another
dependency on bone mass in one of the techniques, although at present
we do not know what it is.
Figure 4. Experimental difference between UWW
and DXA percent fat measurements on bone mass fraction.

It is interesting to note from the data of Figure
4 that the mean value of BMC/FFM for this population is not 4.8% as
given by Brozek, and that there is a significant difference in the
mean value of men and women. The mean values we obtained for BMC/FFM
are 5.2% for men, and 6.5% for women.
Conclusion
The DXA technology has several important advantages
over the UWW method in determination of total body fat percent. DXA
is insensitive or less sensitive to several physiological variables
which can confound the UWW measurement.
In view of the difference between our experimental
values for bone mass fraction and those previously accepted, we suggest
a need for re-examination of the equations used in the UWW method.
References
- Brozek J, et al. Densitometric analysis of body
composition: revision of some quantative assumptions. Ann NY Acad
Sci 1463; 110:112-140.
- Nord RH, Payne RK. Standards for body composition
calibration in DXA. 2nd Bath Con. on Osteoporosis and Bone Min.
Meas. Bath, UK, 1990.
- Diem K, Lentner, C, eds. Scientific Tables. Basle
Switz: Ciba-Geigy Ltd, 1970:523.
- Nord RH, Payne RK. Body composition by DXA—a
review of the technology. Asia Pacific J Clin Nutr 1994;3:
- Pierson RM, et al. Body composition Unit, St Luke's
Hospital, New York. Private communication.
- Clark, RR, et al. Sports Medicine Centre, University
of Wisconsin, Madison. Private communication.

Copyright © 1996 [Asia Pacific Journal of Clinical
Nutrition]. All rights reserved.
Revised:
January 19, 1999
.
 to the top
0