Asia Pacific
J Clin Nutr (1992) 1, 211-223

A food frequency questionnaire
for use in Chinese populations and its validation
Bridget H-H. Hsu-Hage MS(Columbia), PhD(Monash) and
Mark L. Wahlqvist BMedScMD(Adelaide), MD(Uppsala),
FRACP, FAIFST, FACN
Monash University, Department of Medicine, Monash
Medical Centre, Melbourne, Australia.
There is no gold standard in the assessment of individual
dietary intake methodology. The choice of dietary method to estimate
individual intake depends upon the study objectives for the assessment
of individual intake. We adopted a food frequency questionnaire
and modified it for use in a study of food habits and cardiovascular
health status in adult Chinese living in Melbourne. Australia. This
is a semi-quantitative questionnaire (MCHS-FFQ) and is designed
to estimate past food intake. It consists of 220 foods and beverages.
A reference portion is given to obtain a quantitative estimate of
the usual intake portion. Various internal validation tests were
performed. The MCHS-FFQ, being a food frequency dietary method,
does not provide a good estimate of nutrients in foods which are
not served in standard portions. such as sodium. The MCHS-FFQ offered
a good estimate for potassium and protein intake when compared to
estimates derived from a single 24-h urine collection. Finally,
the MCHS-FFQ was predictive of plasma cholesterol levels. We conclude
that the MCHS-FFQ is adequate for the assessment of individual usual
food and nutrient intakes in a representative sample of adult Melbourne
Chinese. For foods that are not served in a standard portion or
quantifiable addition, an alternative more reliable method would
be required for quantitative purposes. The method is. however, likely
to be useful for the appraisal of overall food patterns in Chinese
populations.
Introduction
Studies of food-health relationships require a dietary
method with the capacity to estimate usual or past intake so as to
make comparisons in time or to deal with the variability of dietary
intake. On the other hand, current or short-term dietary methods may
provide a better intake estimate in an intervention study where the
compliance with dietary modification for a particular nutrient
intake needs to be closely monitored over a short period1.
There is no gold standard in the assessment of individual
dietary intake methodology2,3. Up to the 1960s, food records
for a few days or 24-h recalls were the two methods commonly used
by researchers to estimate short-term or current food intake of individuals.
These methods are expensive and unrepresentative of usual intake and
therefore are not appropriate for the assessment of long-term or past
food intake4. With the development of computer techniques
for nutrient database management and statistical analysis, the food
frequency questionnaire has become more widely used in large scale
epidemiological studies5. Twenty-four recalls are still
being used, with interest developing in their repeated application
so that several days of information over an extended period of time
can be obtained prospectively. The choice of dietary method to
estimate individual intake thus depends upon the study objectives
for the assessment of individual intake: particularly in reference
to duration upon which intake estimates are based.
In the Melbourne Chinese Health Study, we are interested
in relationships between food habits and cardiovascular health status
in adult Chinese Australians living in Melbourne, Australia. In order
to assess long-term food habits, we have adapted a food frequency
questionnaire developed by Record and Baghurst6 for use
in Australian populations. We have modified this semi-quantitative
questionnaire so that eating practices pertaining to Chinese food
culture are embraced. We present here the development of a food frequency
questionnaire for use in a Melbourne Chinese population, its application
and potential for generalization.
Methods
We took the CSIRO food frequency questionnaire (FREQPAN)6
as the basis for our modified Chinese food frequency questionnaire.
The CSIRO FREQPAN questionnaire covered foods and beverages commonly
used by Australians and was designed to assess usual intake rather
than short-term intake. It consisted of 179 Australian foods and beverages
with identified standard portion size. Foods and beverages were expressed
in serving sizes or natural units. Subjects were asked to select either
per day, per week or per month as a denominator and then to enter
frequency of use. Subjects could write down S alongside the frequency
of use to indicate a seasonal use for that particular food. In addition,
there was a comment column for usual serving size, if different from
the questionnaire standard.
Food and beverage list. The main task in developing
a food frequency questionnaire for use in an adult Melbourne Chinese
population was to compile a food list that was cross-culturally robust.
For the European type foods, the FREQPAN food list was used. The Chinese
food list was compiled using information collected at various Chinese
grocers, markets and restaurants. Foods were photographed at stores
and Chinese kitchens to record the way in which food was prepared
or served.
Denominators for frequencies. Subjects were
asked to estimate the intake frequency for each food or beverage based
upon one of the usual time frame, namely per day, per week, per month
or per year. In doing so, subjects referred to our 'reference portion'
listed alongside each food or beverage.
Reference portion. The Chinese rice bowl is
a common household measure. It is used to serve rice, a staple in
the traditional Chinese meal setting. For each food or beverage, we
used a 'Chinese rice bowl (approximately 300 ml)' as a reference portion
to estimate usual intake. Reference portion replaced the 'standard
serving size (a correct and recommended amount for consumption)' in
the Melbourne Chinese Health Study Food Frequency Questionnaire (MCHS-FFQ).
Subjects referred to their consumption of each food item in the MCHS-FFQ
in terms of a fraction of a rice bowl, eg 1/2 bowl of beef, 1/2 bowl
of bean sprouts, etc. The identification of foods was facilitated
with the use of colour food photographs at interview.
In a traditional Chinese meal setting, members of
the family usually share ts'ai (dishes) from the centre of
the dinner table, while fan (staple) is served in individual
rice bowls. In such a setting, table manners emphasize taking food
pieces 'equally amongst members', though men and young adults
generally consume a greater portion than women and the aged. Perhaps,
to facilitate the ts'ai sharing practices, Chinese dishes are
usually diced, or sliced before they are cooked. Thus, in addition
to 'portion of a rice bowl', food pieces were also used where appropriate
as a reference portion. Rice bowl equivalents for food pieces were
also used. For example, a 1/2 bowl of stir-fried chicken is equivalent
to about 5 chicken (cut) pieces. There was also a need to use standard
household measures like tea cups, glasses and spoons.
All food intake was ultimately expressed in numbers
of Chinese rice bowls, pieces, or household measures. However, conversion
factors allowed the intake of almost all items to be expressed in
terms of rice bowl equivalents.
Time of intake (meal pattern). The usual times
of the day for food/beverage consumption were also recorded.
Applications. One of the objectives of the
development of the MCHS-FFQ was to assess an individual's usual intake
in the 12 months prior to interview. Subjects were given descriptions
of all parameters (eg the food and beverage list, frequency of intake,
reference portion and time of intake) included in the questionnaire
and instructions to fill out the questionnaire. MCHS-FFQ is bilingual
(Chinese and English). Subjects were encouraged to report foods or
beverages that were frequently consumed and not listed in the MCHS-FFQ.
Extra spaces were provided for additional food items.
Self-administration. The MCHS-FFQ is a self-administered
questionnaire with Chinese and English set side by side. A one-to-one
interview could be arranged for those who were illiterate or less
educated. The interview was conducted in the language spoken at home,
which included Mandarin, Cantonese and Teochew dialects. Whether or
not the subject needed a one-to-one interview was generally established
prior to the interview.
Time taken. The self-administered questionnaire
took about 45 min to one hour to complete. In the case where a one-to-one
interview was required, interview would take up to 21/2 hours.
Role of interviewer. Because the questionnaire
was designed for self-administration, the role of interviewer was
to ensure all food items in the questionnaire were answered. The interviewer
would go through the questionnaire item by item and check at random
the denominator for the frequency of use. The interviewer would also
use the response to the 'usual time of day eaten' to verify 'portion
size' or the 'frequency of use'. Although it rarely happened,
the interviewer might decide to perform a one-to-one interview in
light of doubts about the completeness of the questionnaire. Where
the questionnaire as a whole appeared to be misunderstood, the interviewer
would immediately offer another one-to-one interview or ask that the
questionnaire be repeated. There were only a few subjects (less than
five) who required the additional interview procedures.
Validation. We used several internal mechanisms
to validate the MCHS-FFQ. These considered whether or not the questionnaire
(1) covered foods likely to be consumed by the Melbourne Chinese,
(2) adequately estimated the energy intake in terms of minimal energy
requirement, (3) provided comparable nutrient intake estimates for
appropriate biochemical markers, and (4) had ability to predict health
outcomes.
Percentage of total food intake accounted for by
the MCHS-FFQ. We classified food items into four categories: category
1 was food and beverages consumed by more than 75% of the study population
(frequently consumed foods); category 2 was those consumed by 50 to
75% of the study population (commonly consumed foods); category 3
was foods and beverages consumed by 25 to 50% of the study population
(less commonly consumed foods); category 4 was foods and beverages
consumed by less than 25% of the study population (rarely consumed
foods). We then calculated the number of foods and beverages in each
category.
Additionally, for each subject, we calculated the
percentage food items reported for intake during the 12 month period.
This is called 'intake index' hereafter. Linear relationships between
'intake index' and estimates for daily total energy intake and daily
intakes for protein, total carbohydrates and total fats were examined
using simple regression analyses. The relationships between 'intake
index' and the expected basal metabolic rates were also examined.
Nutrient intakes were estimated using the Australian
Food Composition Table, 1990 edition7. Detailed methodology
for nutrient conversion has been reported elsewhere8.
Total energy intake and estimated BMR by weight.
A dietary method is regarded as invalid if the population habitual
energy intake is less than 1.4 times the expected basal metabolic
rate (BMR)9. In other words, if the expected BMR accounted
for more than 71.5% of the estimated energy intake, then the dietary
method which produced the energy intake estimates would not likely
be valid, discounting a 12.5% coefficient of variation in BMR.
Basal metabolic rate (BMR) is a measurement of the
energy expended for maintenance of normal body functions and homeostasis,
plus a component for activation of the sympathetic nervous system.
BMR is the greatest contributor to total energy expenditure. Allowing
for inter-individual variation and the effects of other component
of energy expenditure, BMR accounts for 60 to 75% of total energy
expenditure. The second largest component of energy expenditure is
the thermic effect of exercise (TEE). TEE represents the cost of physical
activity above basal levels and ranges from 15 to 30% of total energy
requirements in a moderately active individual. It is highly variable.
The thermic effect of food (TEF) is the result of energy expended
to digest, transport, metabolize, and store food. It accounts for
about 10% of daily energy expenditure10. BMR, TEE and TEF
are major components of energy requirements. Energy expenditure may
also be modulated by, or adapt to, for example, climatic change.
We used the Schofield equations to estimate BMI11.
The equations employed body weight to estimate BMR for three age categories,
ie (1) 18 to 30 years old, (2) 30 to 60 years old, and (3) 60 years.
Assuming that 70% of the total energy intake is expended for BMR,
we then calculated the expected energy intake. Student's t-test was
performed to examine whether or not mean total energy intake estimated
by the MCHS-FFQ was the same as that of the expected total energy
intake.
Urinary sodium and potassium excretion. We
collected single 24-h urine random specimens from 97 subjects. Urine
specimens were collected using a cylinder sampler which exacts 1/50
portion of the voided urine. The 24-h volume was then estimated, multiplying
the 1/50 specimens by 50. One ml was used to measure urinary sodium,
potassium and creatinine concentrations. Urine specimens were analysed
at Prince Henry's Hospital (now Monash Medical Centre), Department
of Chemical Pathology (now Department of Clinical Biochemistry). Sodium
and potassium excretion levels are products of urinary concentrations
and volume estimated for 24 h.
The expected sodium intake was calculated based upon
the urinary sodium excretion. allowing for 5% faecal and skin losses.
Similarly, we assumed that 86% of the potassium intake was excreted
through urine12 and calculated the expected potassium intake.
Student's t-test was performed to test whether the expected urinary
sodium and potassium intakes were significantly different from estimates
derived from the MCHS-FFQ.
Total nitrogen output. Urinary total nitrogen
was analysed by the Kjeltec Kjeldahl technique13. Aliquots
of urine specimens were stored in -20°C for two years prior to analysis.
Single measurements were performed at the Monash Medical Centre, Department
of Clinical Biochemistry.
We used estimates by Bingham and Cummings14
that urine nitrogen accounted for 81% of the dietary nitrogen and
calculated the expected nitrogen intake. The expected nitrogen intake
was compared with the nitrogen intake estimates derived from the MCHS-FFQ,
using Student's t-test.
Subjects were categorized into two groups; those whose
nitrogen intake estimate derived from the MCHS-FFQ were higher than
the expected value being derived from the urinary nitrogen. and those
who had a lower estimate. Differences in total energy and nitrogen
intakes, as derived from MCHS-FFQ, and the urinary nitrogen output
were tested.
Ability to predict outcomes. One of the main
objectives of our study was to identify changes in food habits in
relation to cardiovascular risk factor prevalence in Melbourne Chinese.
Multiple finger pricks were applied to collect capillary blood samples.
Plasma total cholesterol and HDL-C were analysed using the KONE 'Progress'
Selective Chemistry Analyser. LDL-C level was calculated based on
the Friedewald formula15. We calculated Pearson's correlation
coefficients to examine whether or not univariate relationships exist
between nutrient intakes and plasma cholesterol levels. Plasma total
cholesterol, high density lipoprotein cholesterol (HLD-C) and low
density lipoprotein cholesterol (LDL-C) levels were examined and treated
as outcomes.
Statistical methods
All statistical procedures were performed using SAS
(Statistical Analysis System)16. The significance level
was set at 5%. Student's t-test was performed to assess differences
between two population means and Pearson's correlation coefficient
was calculated to test whether linear trends exist between two
continuous variables. Population means and standard deviations (in
parentheses) were reported where appropriate.
Results
The MCHS-FFQ
Table 1 gives sample pages selected from the Melbourne
Chinese Health Study Food Frequency Questionaire. This questionnaire
begins with an introduction. Parameters required to estimate the frequency
of usual food intake were stated. A stepwise instruction on how to
fill out the questionnaire was also given. There were 220 foods and
beverages, each in a reference portion attached to it. Denominators
for the frequency of use were per day, per week, per month and per
year. 'The usual time of day eaten' was also requested for each item.
Table l. The Melbourne Chinese Health Study
food frequency questionnaire: sample pages. Chinese text.
| Foods/beverages |
Reference
Portion |
NUMBER OF TIMES EATEN
|
| |
|
Usual time
of day eaten |
Per day |
Per week |
Per month |
Per year |
Never or rarely |
| |
|
|
(put a number in appropriate column)
|
(please tick) |
| Rice vermicelli/noodles
|
1 bowl |
|
|
|
|
|
|
| Mungbean thread |
1 bowl |
|
|
|
|
|
|
| |
3 big |
|
|
|
|
|
|
| Gluten roll/ball |
5 small |
|
|
|
|
|
|
| Steak (grilled) |
1 medium |
|
|
|
|
|
|
| Steak (pan-fried) |
1 medium |
|
|
|
|
|
|
| Roast beef/veal |
2 slices |
|
|
|
|
|
|
| Crumbed veal/schnitzel |
|
|
|
|
|
|
|
| (deep-fried) |
1 large |
|
|
|
|
|
|
| Lean beef/veal in other
|
|
|
|
|
|
|
|
| dishes (stir-fried) |
5 cut pieces |
|
|
|
|
|
|
| |
or 1/2 bowl |
|
|
|
|
|
|
| Pork chop (grilled) |
1 chop |
|
|
|
|
|
|
| Pork chop (pan-fried) |
1 chop |
|
|
|
|
|
|
| Roast pork |
2 slices |
|
|
|
|
|
|
| Lean pork in other dishes |
5 cut pieces |
|
|
|
|
|
|
| (stir-fried) |
or 1/2 bowl |
|
|
|
|
|
|
B: Breakfast M: Morning L: Lunch A: Afternoon D: Dinner
S: Supper
The complete questionnaire can be obtained from the first author.
Validation
Percentage of total food intake accounted for by
the MCHS-FFQ. We found that 48 (22%) items were reported for consumption
by less than 25% of the study population (rarely consumed foods) and
44 (20%) items were reported for regular consumption by more than
75% of the population (frequently consumed foods) (Table 2).
Table 2. Foods and beverages reported for frequent
and rare consumption in the 12 months prior to interviews.
| Items frequently
consumed |
Items rarely consumed |
| Steamed rice |
Raw bran |
| Sliced bread |
Crumpet and muffin |
| Rice vermicelli |
Gluton roll |
| Lean beef, stir-fried
|
Schnitzel |
| Lean pork, stir-fried
|
Dried pork |
| BBQ pork |
Lamb chop, pan-fried |
| Spare ribs |
Lamb, stir-fried |
| Boiled chicken |
Pigeon |
| Chicken breast, stir-fried
|
Pork sausages, pan-fried |
| Chinese sausages |
Beef sausages, grilled |
| Fried egg |
Beef sausages, pan-fried |
| Fresh fish |
Salami and mettworst |
| Crab, prawns and lobster
|
Cottage cheese |
| Abalone and scallops
|
Pure cream |
| Dried shrimps |
Yoghurt |
| Lettuce |
Boiled quail egg |
| Cabbage |
Eel |
| Spinach |
Skimmed milk |
| Broccoli |
Flavoured milk |
| Celery |
Milk shake |
| Cauliflower |
Thick shake |
| Chinese cabbage |
Canned carrots |
| B.ai-choi |
Dried Chinese radish |
| Choi-sum |
Mashed potato |
| Fried onion |
Potato jacket |
| Cucumber Tomato |
Broad beans |
| Fresh carrots |
Tau-miu |
| Green peas |
Soybeans |
| Snow peas |
Papayas |
| Beancurd |
Fruit fritters |
| Bean sprouts |
Preserved plums |
| Chinese dried mushrooms
|
Olives |
| Orange, mandarin and
grapefruits |
Gherkins |
| Apple and pear |
Hamburger without bun |
| Banana |
Meat pie- homemade |
| Watermelon |
Savoury pies and pastries |
| Mango and nectarines
|
Packet soup |
| Fresh grapes |
Ginseng tea |
| Dim sim - steamed varieties
|
Cider |
| Curry |
Walnut shortcake and
biscuits |
| Homemade soup |
Rice pudding |
| Chinese tea |
Milk pudding |
| Water |
Custard |
| |
Vegemite |
| |
Thick sauces |
| |
Sherry |
| |
Port |
| |
Light beer |
On average, responses were obtained for 110 items
in the MCHS-FFQ, ranging from 33 items to 208 items. Figure 1 shows
percentiles for 'intake index' in men and women. There is no difference
in intake index between men and woman.
Figure l. Percentile distribution
for total food intake index, by gender.
Figure 2 shows macro-nutrient intake estimates by
tertiles of the intake index. Macro-nutrient intake estimates were
significantly higher among those in the higher tertiles compared to
the lowest. There was a positive linear trend between macro-nutrient
intake estimates and intake indices, expect for total carbohydrates
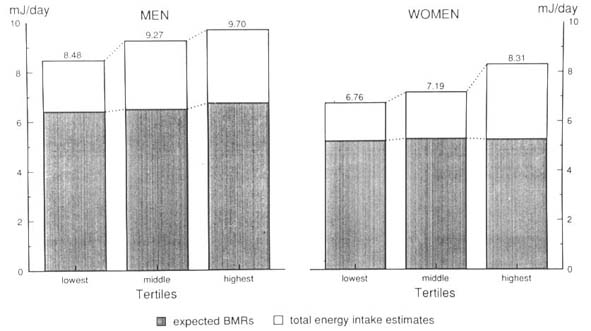
in men. Similarly, there was a positive linear trend between total
energy intake estimates and intake indices. The same trend was not
significant for the estimate BMR. (Figure 3).
Figure 2. Macro-nutrient intake
estimates by tertiles of the intake index. by gender.
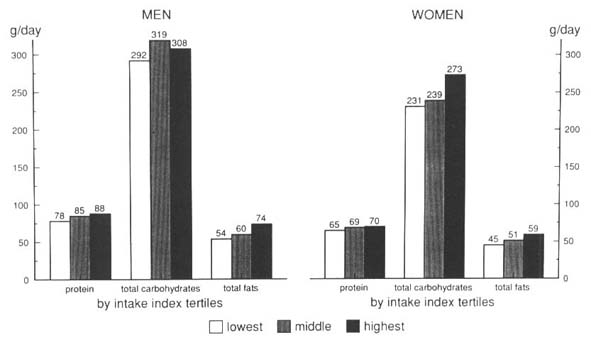
Figure 3. Total energy intake
estimates and the expected basal metabolic rates by tertiles of the
intake index. by gender.
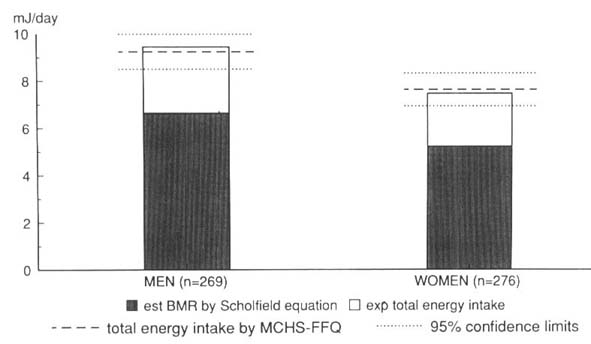
Total energy intake and estimated BMR. The
mean expected total energy intake from BMR was 9.37 (± 1.13) MJ/d
for men and 7.49 (± 0.51) MJ/d for women. The expected total energy
intakes derived from BMR did not differ from those estimated from
the MCHS-FFQ [9.21 (± 2.90) MJ for men and 7.57 (± 2.37) MJ for women]
(Figure 4).
Figure 4. The expected total energy
intake derived from the estimated BMR and the mean and 95% confidence
limits for total energy intake derived from MCHS-FFQ.
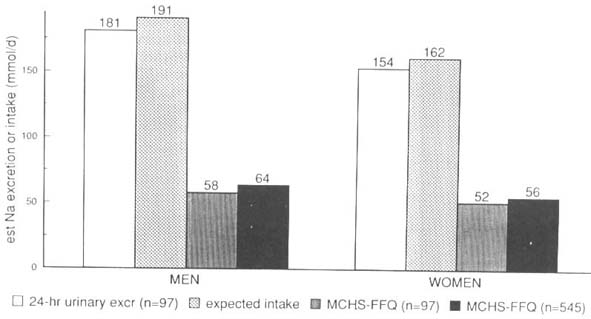
Urinary sodium excretion. On average, the urinary
sodium excretion was 181 (± 86) mmol/d for men and 154 (± 74) mmol/d
for women. This was equivalent to 10.6 g/ d of salt intake for men
and 9.0 g/d for women. The expected sodium intake [191 (± 91) mmol/d
for men and 162 (± 74) mol/d for women] was significantly higher than
the estimate derived from the MCHS-FFQ. The mean sodium intake for
those who collected the urine sample did not differ from the population
mean (Figure 5.)
Figure 5. Average single 24-h
urinary sodium excretion. expected daily sodium intake estimated by
24-h urinary excretion. average daily sodium intake estimated by MCHS-FFQ
for those who collected a 24-h urine sample (n+97) and the total population
(n +545).
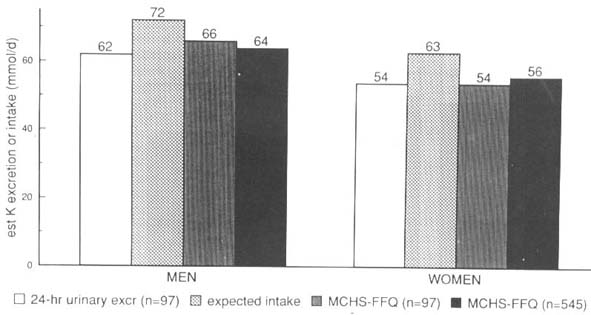
Urinary potassium excretion. Figure
6 shows mean urinary potassium excretion [62 (± 24) mmol/d for men
and 54 (± 32) mmol/d for women], the expected potassium intake (72
(± 28) mmol/d for men and 63 (± 38) mmol/d for women] and the potassium
intake estimate from MCHS-FFQ [66 (± 23) mmol/d for men and 54 (±
23) mmol/d for women]. No differences were found between the potassium
intake calculated from the urinary excretion and that estimated from
the MCHS-FFQ, for those who collected the urine sample and for the
entire population.
Figure 6. Average single ~4-h
urinary potassium excretion. the expected potassium intake estimated
by 24-h urinary excretion the average daily potassium intake estimated
by MCHS-FFQ for those who collected a 21-h urine sample (n + 97) and
the total population (n= 545).
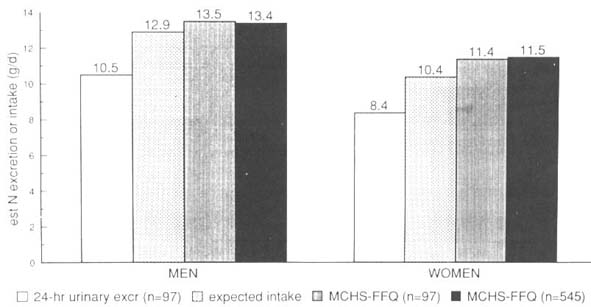
Total nitrogen output and protein intake. The
expected mean nitrogen intake level was 12.9 (± 6.2) g/d for men and
10.4 (± 4.6) g/d for women. Figure 7 shows that there was no difference
between the expected nitrogen intake and the estimates derived from
the MCHS-FFQ [13.5 (± 4.1) g/d for men and 11.4 (± 4.1) g/d for women].
Figure 7. Average single 24-h
urinary nitrogen output. the expected daily nitrogen intake estimated
by 24-h urinary excretion the average daily nitrogen intake
estimated by MCHS-FFQ for those who collected a 24-h urine sample
(n+ 97) and the total population (n +545).
There was no linear relationship between the log-transformed
urinary total nitrogen output and log-transformed nitrogen intake
estimated from the MCHS-FFQ for the entire study population. However,
positive associations were found when separate analyses were performed
in those who had a nitrogen intake derived from the MCHS-FFQ below
or above the expected intake derived from the urinary excretion. The
log-transformed urinary nitrogen output was positively and significantly
related to the log-transformed nitrogen intake from MCHS-FFQ in three
of the four separate analyses. No linear relationship was found in
women whose MCHS-FFQ estimated nitrogen intake was greater than the
expected intake (Figure 8).
Figure 8. Relationships between
nitrogen intake estimates (log-transformed) and single 24-h urinary
total nitrogen output (log-transformed) for individuals with an MCHS-FFQ
estimate above or below the expected intake estimate being derived
from urinary excretion.
Figure 9 shows that individuals who had an MCHS-FFQ
nitrogen intake estimate above the expected value had a lower total
energy and nitrogen intake estimate compared to their counterparts.
These comparisons were statistically significant for women only.
Figure 9. Total energy and nitrogen
intake estimates by MCHS-FFQ estimate above or below the expected
intake estimate being derived from urinary excretion.
Ability to predict plasma cholesterol levels. Table
3 shows Pearson's correlation coefficients for univariate relationships
between plasma cholesterol levels and nutrient intakes derived from
the MCHS-FFQ. Positive relationships were found between total fat
intake or the percentage energy intake from total fat, as derived
from the MCHS-FFQ, and plasma total or LDL cholesterol levels in men,
but not women. Total energy intake, for women, and total carbohydrate
or the percentage energy intake from total carbohydrate for men and
women predicted plasma total and LDL cholesterol levels in a favourable
fashion.
Table 3. Significant univariate associations
between nutrient intakes and plasma cholesterol variables.
| Nutrients |
|
r |
P-value |
| Total Cholesterol
(mmol/l) |
|
|
|
| |
MEN |
|
|
| |
Fat (%kJ) |
0.14 |
0.0178 |
| |
Carbohydrate (%kJ) |
-0.16 |
0.0087 |
| |
WOMEN |
|
|
| |
Total energy (kJ/d) |
-0.14 |
0.0227 |
| |
Total carbohydrate (g/d) |
-0.16 |
0.0080 |
| HDL-C (mmol/l) |
|
|
|
| |
MEN |
|
|
| |
Alcohol (g/d) |
0.20 |
0.0010 |
| |
Alcohol (%kJ) |
0.23 |
0.0002 |
| |
WOMEN |
|
|
| |
Total energy (kJ/d) |
0.13 |
0.0321 |
| |
Total fat (g/d) |
0.16 |
0.0067 |
| |
SFAs (gld) |
0.18 |
0.0028 |
| |
MUFAs (g/d) |
0.14 |
0.0209 |
| |
PUFAs (g/d) |
0.14 |
0.0203 |
| |
Dietary cholesterol
(g/d) |
0.13 |
0.0375 |
| |
Sodium (mg/d) |
0.14 |
0.0191 |
| |
Calcium (mg/d) |
0.16 |
0.0065 |
| |
Phosphorus (mg/d) |
0.13 |
0.0310 |
| |
Iron (mg/d) |
0.14 |
0.0191 |
| |
Riboflavin (mg/d) |
0.14 |
0.0195 |
| |
SFAs (%kJ) |
0.18 |
0.0033 |
| |
Fat (%kJ) |
0.15 |
0.0156 |
| |
M/S ratio |
-0.13 |
0.0321 |
| LDL-C (mmoUI) |
|
|
|
| |
MEN |
|
|
| |
Total fat (g/d) |
0.14 |
0.0209 |
| |
SAFs (g/d) |
0.16 |
0.0087 |
| |
MUFAs (g/d) |
0.13 |
0.0316 |
| |
Fat (%kJ) |
0.20 |
0.0010 |
| |
Carbohydrate (%kJ) |
-0.17 |
0.0057 |
| |
WOMEN |
|
|
| |
Total energy (kJ/d) |
-0.15 |
0.0116 |
| |
Total carbohydrate (%kJ) |
-0.18 |
0.0031 |
| |
Calcium (mg/d) |
-0.13 |
0.0277 |
| |
Retinol (mg/d) |
-0.13 |
0.0285 |
| |
Retinol equivalents
(mg/d) |
-1.13 |
0.0298 |
%kJ, percentage energy intake of; SFAs, saturated
fatty acids; MUFAs, mono-unsaturated fatty acids; PUFAs, poly-unsaturated
fatty acids; M/S ratio, MUFA to SFA intake ratio.
Discussion
Characteristics of the
MCHS-FFQ
In the course of developing a dietary method for use
in a Melbourne Chinese population, we considered several dietary methods4,17-21
and attempted to adopt and improve an existing method that would measure
individual usual intakes in Chinese Australians living in Melbourne.
Additionally, we were interested in a less expensive method which
would take advantage of newer computer technology.
The CSIRO FREQPAN6 had been used in a large
dietary survey in the state of Victoria, Australia, from which our
study population was drawn. The questionnaire had been tested and
developed for computerized processes. It was suitable for estimation
of the assessment of individual usual intakes. For these reasons,
the food frequency questionnaire, rather than any other dietary intake
method, was used.
We have also considered the need to develop a reference
portion so that food intake can be quantified in a manner that
was culturally relevant. The way in which a Chinese family conducts
its meal setting was considered and the traditional Chinese rice bowl
was used as a reference portion for most foods. Because different
type of foods are usually served in accordance with meal setting we
have used the 'usual time of the day eaten' for internal validity
at the interview.
Approaches in validation
Various approaches have been used to evaluate the
performance of food frequency questionnaires. One common approach
is to compare nutrient intake estimates of individuals in the study,
using correlation coefficients to evaluate the agreement, with those
derived from an independent standard4,21-26. Because there
is no gold standard method for dietary assessment. and the nature
and/or major sources of error produced by an alternative dietary method
are often fairly similar to the one to be validated 2,4,27.
the choice of an independent standard for the validation of a dietary
assessment methodology may therefore introduce a validity problem
in itself. Comparisons of group means of intake estimates are also
questionable as a validity exercise. A serious concern is that such
comparisons disregard possible differences in nutrient intake among
individuals and the same amount of food, or the same nutrient intakes,
across population groups4.
The reproducibility of individual nutrient intakes
has also been widely used to validate a dietary method28.
This approach differs from previous approaches, in that research investigators
use the same dietary method repeatedly over a range of time intervals
and assess the agreement in individual nutrient intakes. There is.
however, a fundamental problem in the interpretation of reproducibility
and validity of a dietary method.4 As individual dietary
intake is highly variable, a low agreement in estimates between time
intervals may simply reflect changing eating practices of individuals.
This is particularly important in the study of migrant health, as
in our study. Individual dietary change is often considered a major
determinant of changing disease patterns. We used internal validation
so that various nutrient 'intake indices' derived from the 220-item
food frequency questionnaire could be assessed.
The need for a comprehensive
food and beverage list
Foods and beverages frequently consumed by the population
were mostly traditional Chinese foods or foods in abundant
supply. On the other hand, traditional Chinese foods that are less
accessible in general food supply, snacks and non-traditional Chinese
foods were rarely consumed by the Melbourne Chinese (Table 2). This
implied that the food consumption pattern of Melbourne Chinese
remains traditionally Chinese and limited to accessible foods.
It is equally appropriate to consider food intake patterns associated
with food acculturation with a shift toward the Australian way of
eating and its related health outcomes. Thus the inclusion of foods
and beverages rarely consumed by the study population should not be
seen as being redundant in this particular study.
Macro-nutrient intakes
Where a complete food list is provided, one would
expect to observe a positive relationship between intake index' and
either total energy intake or the expected basal metabolic rate, and
positive relationships between intake index and some macro-nutrients.
We observed increases in major macro-nutrient intake as intake index
increased, except for total carbohydrate intake in men (Figure 2).
Additionally, increases in total energy intake with intake index were
accounted for by intakes in excess of the expected BMR (Figure 3).
In other words, individuals responding to a higher percentage of foods
in the questionnaire had a higher energy intake which was independent
of BMR. Our result also suggests that the total energy intake was
adequately estimated using the MCHS-FFQ (Figure 4), so that the minimal
energy requirement is met29.
Sodium and potassium intake
estimates
The food frequency questionnaire depends upon portion-size
estimation of quantitative intake. As a result of this, foods which
are not served in standard portion are likely to be under-estimated8.
In this study, a I day sodium intake was estimated from a 24-h urinary
sodium excretion. Urinary sodium excretion over I day may not be representative
of a year-long Chinese diet probed by the food frequency questionnaire.
Nevertheless, if the assumption is made that urinary sodium intake
is correct, it is clear that the food frequency questionnaire would
have under-estimated true sodium intake (Figure 5). The agreement
between potassium intake estimated from a urinary excretion and the
MCHS-FFQ (Figure 6) suggests that the MCHS-FFQ has the ability to
estimate daily potassium intake similar to that of single 24-h urine
sample. This implied that potassium balance may fluctuate less than
sodium balance across a year and/or there is less problem with unmeasured
potassium additions in a Chinese diet than sodium additions. Sources
of added sodium intake in a Chinese diet are soysauce. salt. mono-sodium
glutamate (MSG) and stock8.
Urinary nitrogen output
and protein intake
There was no difference in population mean nitrogen
level estimated from the 24-h urinary nitrogen output and the MCHS-FFQ
(Figure 7). Our results did not support an intra-individual relationship
between estimates derived from the two independent methods for the
entire population (Figure 8). This is probably due to daily variation
in dietary intake and marked daily fluctuations in daily nitrogen
balance. Bingham and Cummings14 showed that single 24-h
urine collection can be substantially in error. In healthy individuals
with normal western diets, an 8-day 24-h urine nitrogen collection
would verify its completeness and a dietary assessment from 18 days
of records or 24-h recalls would minimize reporting errors from such
methods.
When considered separately for those who had a nitrogen
intake estimate by MCHS-FFQ higher or lower than the expected nitrogen
intake, as derived from the single 24-h urinary nitrogen output, our
data confirmed intra-individual relationships between urinary total
nitrogen output and nitrogen intake estimated by MCHS-FFQ. In all
cases, slopes were attenuated for both men and women and the linear
relationships were less pronounced in women (Figure 8). This indicates
that the lack of one-to-one relationships between the 24-h urinary
nitrogen output and the MCHS-FFQ estimated nitrogen intake may depend
upon the level of true protein intake. Individuals with a higher protein
intake have been shown to have a lower urinary nitrogen output than
expected14,30. This is confirmed in our study, particularly
in women (Figure 9). The gender differences in the significance levels
further suggest that a higher total energy intake in men, as estimated
by MCHS-FFQ, have resulted in a lower urinary nitrogen output.
In summary, single 24-h urinary nitrogen output is
not appropriate for the individual validation of protein intake because
the steady state condition is rarely achieved in free-living individuals
and large day-to-day fluctuations in protein intake exist. The single
24-h urinary nitrogen output, however, provides a good ball park figure
for the validation of population mean protein intake in the case where
urinary nitrogen does not exceed the estimate of dietary intake over
a short period of time14. The MCHS-FFQ thus gives a reasonable
estimate of the population mean protein intake.
Predictive power of the
MCHS-FFQ
One of the most important expectations for a dietary
method is that it should predict outcome variables. A method cannot
be claimed as valid or reliable if it fails to demonstrate the ability
to predict what it is supposed to. The emphasis in tackling problems
associated with various dietary methods has been on external validation
against an independent method or on internal reliability tests over
a time2,3,31. Neither approach has taken into account the
possibility of errors associated either with the methods themselves
or the use of alternative methods to validate them. The predictive
power of a dietary method has rarely featured. however. in the considerations.
Nutrient estimates derived from the MCHS-FFQ are capable
of predicting health outcomes (Table 3). Although Table 3 shows univariate
associations, similar results were found in the multivariate models8.
Positive relationships between fat intake and plasma cholesterol and
coronary heart disease are well established. To mention a few, the
same predictive power of dietary fat intake, particularly saturated
fatty acids and the percentage energy of fat intake. for 4-year coronary
incidence has been reported in the young Framingham cohort32
and in the l0-year coronary mortality in Japanese men living in Hawaii33.
Less evidence is available in the cross-sectional studies. A cross-sectional
relationship between fat intake, particularly saturated fatty acid
intake, and plasma cholesterol has however been reported in a coloured
population in South Africa34. As cross-sectional relationships
are likely to be attenuated due to cohort effect, such relationships
when identified would be better appreciated in a longitudinal study
(Figure 10). Thus, the validity of MCHS-FFQ is appropriate insofar
as the predictive power of plasma cholesterol and other health outcomes
is concerned.
Fig. 10. Cross-sectional vs longitudinal
relationships between health outcome and its determinants.
In conclusion, the MCHS-FFQ is a simple and valid
method in the assessment of usual food intake in a representative
adult Chinese living in Melbourne. Australia. The method, when carefully
applied, provides a reasonable estimate of all macro-nutrients and
has the ability to predict the major health outcomes we explored.
The method, however, is not appropriate for estimation of foods not
served in a standard portion or as quantifiable additions. Where such
foods or food sources of nutrient are of importance to the study outcomes,
an alternative or supplementary method will be required to remove
these sources of error.
Acknowledgement. This project received a seeding grant from the Australian National Health
and Medical Research Council (NH&MRC), the Public Health Research
and Development Committee. Bridget Hsu-Hage was a recipient of the
NH&MRC Public Health Research and Development Fellowship. The
authors wish to thank Melbourne Chinese community organization for
their endorsement and Dr John Powles and Dr Graeme Oliver for their
early involvement in the project.
Correspondence address: Dr Bridget H-H. Hsu-Hage,
Monash University Department of Medicine, Monash Medical Centre. 246
Clayton Road Level 5. Block E. Clayton, Victoria 3168. Australia.
Fax +613 550 5524.
References
1 Elmer PJ. Dietary methods in cardiovascular disease
critique. Vital Hlth Slat [4] 1992; 27:32 4.
2 Bingham SA. Limitations of the various methods for
collecting dietary intake data. Ann Nutr Metab 1991; 35: 1 17-27.
3 Block G. A review of validations of dietary assessment
methods AM J Epidemiol 1982; 115:492-505.
4 Willett W. Nutritional epidemiology. New York: Oxford
University Press, 1990.
5 Medlin C Skinner JD. Individual dietary intake methodology:
a 50-year review of progress. J Am Diet Ass 1988; 88: 1250-7.
6 Record S, Baghurst K. Dietary assessment by computer:
User's manual. Adelaide: CSIRO Division of Human Nutrition, 1987.
7 Commonwealth of Australia. Composition of foods,
Australia. 1990. Canberra: Australian Government Publishing,Services
1990.
8 Hage. BH-H. Food habits and cardiovascular health
status in adult Melbourne Chinese. Thesis Monash University Department
of Medicine 1992.
9 Bingham SA. The dietary assessment of individuals;
methods, accuracy, new techniques and recommendations. Nutrition Abstracts
and Review 1987; 57:724-7.
10 Devlin JT. Horton ES. Energy requirements. In:
Brown ML (ed). Present knowledge in nutrition. International Life
Sciences Institute, Nutrition Foundation, Washington DC. 1990.
11 Schofield MN. Predicting basal metabolic rate new
standards and review of previous work. Hum Nutr: Clin Nutr 1985; 39C
(Suppl 1):5-41.
12 Schachter J, Harper PH, Radin ME, Caggiula AW,
McDonald RH Diven WF. Comparison of sodium and potassium intake with
excretion. Hypertension 1980; 2:695-9.
13 Tecator Ltd. Cooper Road Thornbury Bristol, England
BS12 2UP.
14 Bingham SA, Cummings JH. Urine nitrogen as an independent
validatory measure of dietary intake: a study of nitrogen balance
in individuals consuming their normal diet. AM J Clin Nutr 1985; 42:1276-89.
15 Friedewald WT, Levy RI, Fredrickson DS. Estimation
of the concentration of low-density lipoprotein cholesterol in plasma,
without use of the preparative ultracentrifuge. Clin Chem 1972; 18:499-502.
16 SAS Institute Inc. SAS/STAT User's Guide, Release
6.03 edition. Cary: SAS Institute Inc, 1988.
17 Burke BS. The dietary history as a tool in research.
J Am Diet Ass 1947; 23:1041-6.
18 Stefanik PA, Trulson MF. Determining the frequency
of foods in large group studies. Am J Clin Nutr 1962; 11:335-43.
19 Balogh M, Medalie JH, Smith H, Groen JJ. The development
of a dietary questionnaire for an ischaemic heart disease survey Israel
J Med Sci 1968; 4:195-203.
20 Balogh M, Kahn HA. Medalie JH. Random repeat 24-hour
dietary recalls. Am J Clin Nutr 1971; 24:304-10.
21 Borrelli R, Cole TJ, Di Biase G, Contaldo F. Some
statistical considerations on dietary assessment methods. Eur J Clin
Nutr 1989; 43:453-63.
21 Marr JW. Individual dietary surveys: Purposes and
methods. Wld Rev Nutr Diet 1971;13:105 64.
22 Eck LH, Klesges RC, Hanson CL, Slawson D, Portis
L, Lavasque ME. Measuring short-term dietary intake: development and
testing of a l-week food frequency questionnaire. J Am Diet Assc 1991:
91:940 5.
23 Jenner DA, Neylon K, Croft S, Beilin LJ. Vandongen
R. A comparison of methods of dietary assessment in Australian children
aged 11-12 years. Eur J Clin Nutr 29 1989; 43:663 73.
24 Posner BM, Martin-Munley SS, Smigelski C. Cupples
LA. Cobb JL. Schaefer E, Miller DR. D Agostino RB. Comparison of techniques
for estimating nutrient intake: the Framingham Study. Epidemiology
1992; 3:171-7.
25 Stein AD, Shea S, Baseh CE, Contento IR. Zybert
P.Consisteney of the Willett semiquantitative food frequency questionnaire
and 24-hour dietary recalls in estimating nutrient intakes of pre-school
children. Am J Epidemiol 1992; 135:667-77.
26 Suitor CJ, Gardner J, Willett WC. A comparison
of food frequency and diet recall methods in studies of nutrient intake
of low-income pregnant women. J Am Diet Assc1989; X9: 1986-94.
27 Hebert JR. Miller DR. The inappropriateness of
conventional use of correlation coefficient in assessing validity
and reliability of dietary assessment methods. Eur J Epidemiol 1991;
7:339 43.
28 Bloemberg BP. Kromhout D. Obermann-De Boer GL.
Van Kampen-Donker M. The reproducibility of dietary intake data assessed
with the cross-check dietary history method. Am J Epidemiol 1989;
130:11147-56.
29 James WPT. Comments on the new equations. Human
Nutr: Clin Nutr 1985; 39C (Suppl 1):92-6.
30 Alpers DH. Clouse RE, Stenson WF. Manual of nutritional
therapeutics. Boston. Mass: Littlc Brown. I983. pp 101.
31 Block G. Human dietary assessment: methods and
issues. Preven Med 1989; 18:653-60).
32 Posner BM, Cobb JL, Belanger AJ. Cupples LA, D
Agostino RB. Stokes J 3d. Dietary lipid predictors of coronary heart
disease in men. The Framingham Study. Arch Intern Mcd 1991: 151(6):1
181-7.
33 McGee D. Reed D. Stemmerman G. Rhoads G. Yano K,
Feinlcib M. The relationship of dietary fat and cholesterol to mortality
in 10 years: the Honolulu Heart Program. Int J Epidemiol 1985; 14(1):97-
1115.
34 Steyn K. Langenhoven ML. Joubert G. Chalton DO,
Benade AJ. Rossouw JE. The relationship between dietary factors and
serum cholesterol values in the coloured population of the Cape Peninsula.
S Afr Med J 1990; 78(2):63-7.
A food frequency questionnaire for
us in Chinese populations and its validation
B. H-H. Hsu-Hage and Mark L. Wahlqvist
Asia Pacific Journal of Clinical Nutrition 1992; 1. 211-223
Copyright © 1992 [Asia Pacific Journal of Clinical
Nutrition]. All rights reserved.
Revised:
January 19, 1999
.
 to the top