Asia Pacific J Clin Nutr (1992) 1, 153-158

Determination of tocotrienol and
tocopherol isomers at physiological concentration by HPLC in Caucasian
and Japanese women
Che Sam Lo, Mark L Wahlqvist, Yoshimitsu
Horie*, Kazuyo Horie** and Naiyana Wattanapenpaiboon
Department of Medicine, Monash Medical
Centre, Monash University, Melbourne, Australia, *Nagoya Municipal
Women's Junior College, Nagoya, Japan, and **Aichi Gakusen University,
Okazaki, Aichi, Japan.
A sensitive, specific and simple method
for simultaneous evaluation of tocopherol and tocotrienol isomers
in human serum by normal phase HPLC with a fluorescence detector
has been developed. Tocopherol and tocotrienol isomers are measurable
in physiological concentration in human serum by this method. There
is no significant difference in serum alpha- and beta-tocopherols
and alpha-, gamma-, and delta-tocotrienols between Caucasian and
Japanese subjects. However, serum gamma- and delta-tocopherol concentrations
in Japanese women are significantly higher than in Caucasian women.
Introduction
Most interest in vitamin E centres around
cardiovascular disease and cancer because of is natural antioxidant
capabilities1-3. Little is known about tocotrienol and
tocopherol isomer status in health or disease or how such status varies
with food culture or ethnicity.
In the present study we sought: (1) to
develop an HPLC method for the simultaneous assessment of serum tocotrienol
and tocopherol isomer status, applicable to clinical and population-based
studies; and (2) to assess the status of these compounds in those
with disparate food cultures, Caucasian and Japanese.
Subjects
and methods
The study involved 14 apparently healthy
Caucasian women from Melbourne, Australia and 21 age-matched healthy
Japanese women from Nagoya, Japan (Table 1).
Table 1. The age, stature, body
weight and body mass index (BMI) of Caucasian and Japanese women (Mean
± SEM).
| Subjects |
n |
Age (years) |
Stature (cm) |
Body weight (kg) |
BMI (kg/m2) |
| Caucasian |
14 |
49± 2 (40-62) |
163± 1 (154-170) |
63± 3 (49-94) |
23.8± 1.4 (19.5-35.3) |
| Japanese |
21 |
50± 1 (4 1-59) |
155± 1 (143-161) |
54± 1 (43-64) |
22..5± 0.6 (16.8-28.1) |
Each subject was asked not to eat or
drink anything other than water after 8.00 pm until after the blood
test the following morning. A fasting blood sample was collected at
8.30-9.00 am for tocotrienol and tocopherol isomer estimation.
The serum samples were prepared as follows.
(1) Storage at -70° C. (2) Extraction and measurement were conducted in a darkroom
with a red filtered light. (3) 300m l of serum were precipitated
with 300m l of methanol and the tocotrienol
and tocopherol isomers extracted with 1.2ml of hexane. (4) Samples
were then vortexed and centrifuged and 0.8ml of supernatant pipetted
into a 3ml brown bottle. (5) The sample was dried under nitrogen and
redissolved in 50m l of hexane. (6) Duplicate
20m l samples were applied through the U6K injector to the
HPLC column.
The HPLC column was m -Porosil, 10m m (30 cm x 0.46 cm ID); the mobile phase was hexane/isopropanol
(99.5/0.5 by volume); the flow rate was 2.2 ml/min and detection was
with an F-1050 Hitachi fluorescence detector at EX 298 nm, EM 325
nm with attenuation 8; ambient temperature was 20-25°C. Tocopheryl
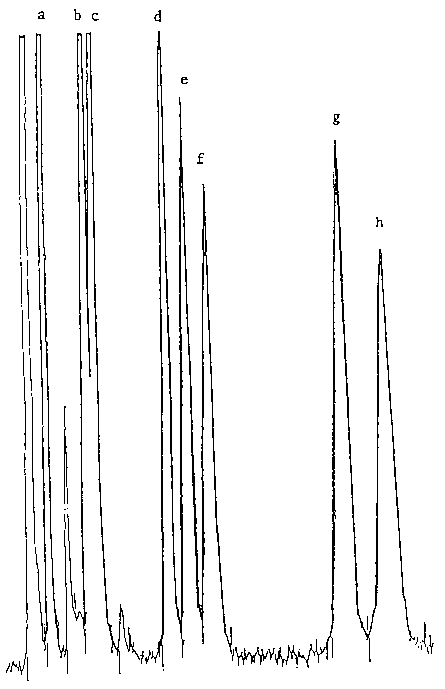
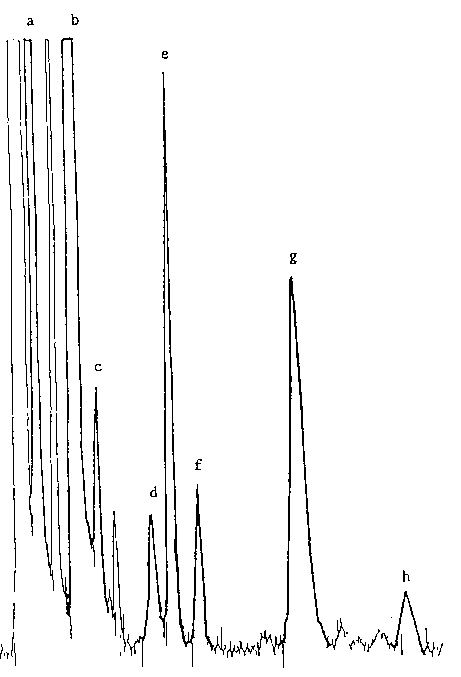
acetate was used as an internal standard. Figures I and 2 are beta-toeopherol,
gamma-toeotrienol and delta-toeotrienol typical chromatograms for
standard tocotrienols and between Caucasian and Japanese women. However,
toeopherols and ror serum from a Caucasian women. Reproducibility
and recovery of tocotrienol and tocopherol i.somers are shown in Table
2.
| Figure 1. Chromatogram
of a standard solution. a: tocopheryl acetate as internal standard
(RT 1.99); b: alpha-tocopherol (RT 3.13); c: alpha-tocotrienol
(RT 3.39); d: beta-tocopherol (RT 5.39); e: gamma-tocopherol (RT
5.97); f: gamma-tocotrienol (RT 6.58); g: delta-tocopherol (RT
10.35); h: delta-tocotrienol (RT 11.53). |
 |
| Figure 2. Chromatogram
of a serum extract. a: tocopheryl acetate as internal standard
(RT 1.97); b: alpha-tocopherol (RT 3.07); c: alpha-tocotrienol
(RT 3.73); d: beta-tocopherol (RT 5.29); e: gamma-tocopherol (RT
5.80); f: gamma-tocotrienol (RT 6.57); g: delta-tocopherol (RT
9.54); h: delta-tocotrienol (RT 12.58). |
 |
Table 2. Reproducibility and recovery
of tocotrienol and tocopherol isomers.
| Vitamin
E isomers |
Reproducibility (%CV, n=8) |
Recovery (%, n=8) |
| alpha-tocopherol |
2.3 |
101.9 |
| alpha-tocotrienol |
5.0 |
100.9 |
| beta-tocopherol |
7.8 |
98.5 |
| gamma-tocopherol |
5.2 |
96.0 |
| gamma-tocotrienol |
3.2 |
92.2 |
| delta-tocopherol |
5.8 |
96.6 |
| delta-tocotrienol |
8.2 |
95.5 |
Results
Tocotrienol and tocopherol isomer levels
in women's serum are shown in Table 3. There are no significant differences
in serum alpha-tocopherol, alpha-tocotrienol, beta-tocopherol, gamma-tocotrienol
and delta-tocotrienol between Caucasian and Japanese women. However,
Japanese women had significantly higher gamma-tocopherol concentrations
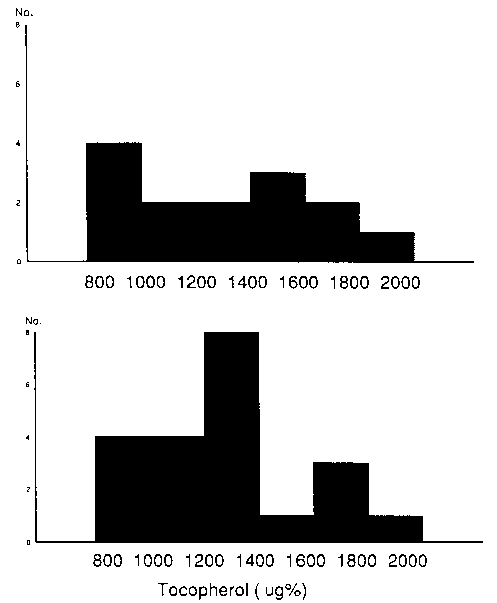
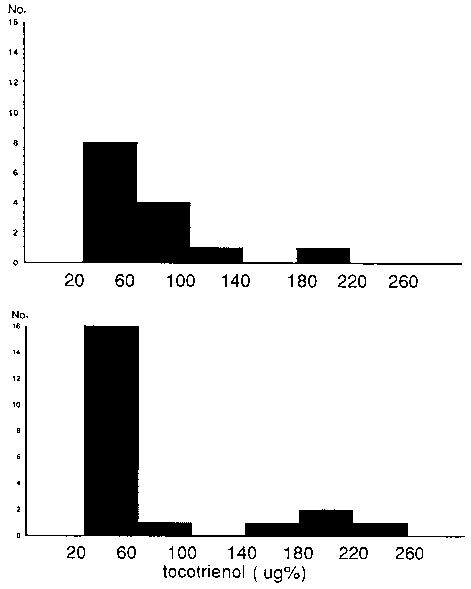
than did Caucasian women (Table 3). Distribution of tocopherol and
tocotrienol in women's serum are shown in Figures 3 and 4.
Table 3. Tocotrienol and tocopherol
isomer levels in women's sera, (microgram/100 ml serum, mean ± SEM).
| |
Japanese (n=21) |
Caucasian (n=14) |
| alpha-tocopherol |
1134± 67 |
1205± 98 |
| alpha-tocotrienol |
37.8± 11.9 |
27.8± 6.2 |
| beta-tocopherol
|
21.4± 1.3 |
20.0± 1.7 |
| gamma-tocopherol |
109.0± 9.0** |
43.3± 6.5 |
| gamma-tocotrienol
|
22.8± 1.5 |
31.5± 11.0 |
| delta-tocopherol
|
23.2± 3.7* |
8.1± 0.08 |
| delta-tocotrienol
|
12.4± 1.8 |
8.6± 1.1 |
| Total tocopherol
|
1287.2± 74.0 |
1276.1± 102.0 |
| Total tocotrienol
|
73.0± 13.74 |
68.4± 13.3 |
n is the number of subjects. The mean± SEM are shown. The significant differences between Caucasian and
Japanese women are indicated by * P<0.005, **P<0.001.
| Figure 3. Distribution
of serum tocopherol of 14 Caucasian women (top) and 21 Japanese
women (bottom). |
 |
| Figure 4. Distribution
of serum tocotrienol of 14 Caucasian women (top) and 21 Japanese
women (bottom). |
 |
Discussion
A sensitive, specific and simple method
of simultaneous evaluation of alpha-, beta-, gamma-, delta-tocopherols
and alpha-, gamma-, delta-tocotrienols in human serum by normal phase
HPLC with a spectrofluorometer has been developed. Tocotrienol and
tocopherol isomers are measurable in physiological concentration in
human serum by this method.
There is no significant difference in
serum levels of alpha- and beta-tocopherols and alpha-, gamma-, and
delta-tocotrienols between Caucasian and Japanese subjects. However,
serum gamma- and delta-tocopherol concentrations in Japanese women
are significantly higher than in Caucasian women.
The reasons for these differences are
not clear. One possibility is that Caucasian and Japanese women have
different intake of the isomers on account of the cultural food differences.
For example, soybean oil is peculiarly high in gamma- and delta-tocopherols
which is consumed more by people in Japan than by people in Australia.
There are, however, few data on tocopherol and tocotrienol isomers
composition of food (Table 44,5). Other possibilities are
that there is interconversion of isomers or distribution in body compartments,
that is different in the two groups of women. That serum tocotrienol
level is usually less than tocopherol level would be consistent with
conversions of tocotrienol to tocopherol, although this may simply
reflect intake. However, either the absorption, the catabolism or
the excretion of tocopherol and tocotrienol may also be different
between Caucasian and Japanese women.
Table 4. Tocopherol and tocotrienol
content of food.4,5
| Food |
Tocopherol (mg%) |
Tocotrienol (mg%) |
| |
Alpha |
Beta |
Gamma |
Delta |
Alpha |
Beta |
Gamma |
Delta |
| Coconut
oil |
0.5 |
- |
0 |
0.6 |
0.5 |
- |
- |
- |
| Cottonseed
oil |
38.9 |
- |
38.7 |
0 |
0 |
- |
- |
- |
| Olive oil |
5.1 |
- |
Tr |
0 |
0 |
- |
- |
- |
| Palm oil |
25.6 |
- |
31.6 |
7.0 |
14.3 |
3.2 |
- |
28.6 |
| Peanut
oil |
18.9 |
- |
21.4 |
2.1 |
0 |
- |
- |
- |
| Rapeseed
oil |
23.6 |
- |
38.0 |
1.2 |
0 |
- |
- |
- |
| Safflower
oil |
39.6 |
- |
17.4 |
24.0 |
0 |
- |
- |
- |
| Soybean
oil |
7.9 |
- |
59.3 |
26.4 |
0 |
- |
- |
- |
| Sunflower
oil |
48.7 |
- |
5.1 |
0.8 |
0 |
- |
- |
- |
| Wheatgerm
oil |
119.4 |
71.0 |
26.0 |
27.1 |
2.7 |
18.1 |
- |
- |
| Maize oil |
11.2 |
5.0 |
60.2 |
1.8 |
0 |
- |
- |
- |
| Barley
pearl, raw |
0.2 |
0.3 |
- |
- |
1.2 |
- |
- |
- |
| Bran wheat |
1.6 |
1.0 |
- |
- |
1.1 |
- |
- |
- |
| Flour wholemeal
(100%) |
1.0 |
0.7 |
- |
- |
0.4 |
- |
- |
- |
| Oatmeal
raw |
0.8 |
- |
0.1 |
0 |
1.0 |
- |
- |
- |
| Rice, polished,
raw |
0.3 |
- |
0.3 |
- |
- |
- |
- |
- |
| Rye flour
(100%) |
0.8 |
- |
0.1 |
0 |
1.0 |
- |
- |
- |
| All-bran |
2.0 |
- |
1.6 |
- |
- |
- |
- |
- |
| Grapenuts |
1.6 |
- |
0.6 |
- |
- |
- |
- |
- |
| Puffed
wheat |
1.7 |
- |
2.5 |
- |
- |
- |
- |
- |
| Whole yellow
com |
1.5 |
- |
5.1 |
- |
0.5 |
- |
- |
- |
| Shredded
wheat |
1.0 |
- |
2.0 |
- |
- |
- |
- |
- |
| Weet-bix |
1.8 |
- |
2.2 |
- |
- |
- |
- |
- |
| Peach |
1.3 |
- |
- |
- |
- |
- |
- |
- |
| Strawberry |
1.2 |
- |
- |
- |
- |
- |
- |
- |
| Apple |
0.3 |
- |
- |
- |
- |
- |
- |
- |
| Asparagus |
1.6 |
- |
- |
- |
- |
- |
- |
- |
| Broccoli |
2.0 |
- |
- |
- |
- |
- |
- |
- |
| Spinach |
2.5 |
- |
- |
- |
- |
- |
- |
- |
| Carrot |
0.4 |
- |
- |
- |
- |
- |
- |
- |
To compare the possibility that the level
of body fatness may be a contributory factor to tocopherol and tocotrienol
status, we related these serum measurements to body mass index (BMI),
but there was no significant difference in our study (Table 5). In
addition, there is also no significant difference of tocopherol and
tocotrienol status between pre- and post-menopausal women in our study
(Table 6).
Table 5. Correlation (r) between
serum tocopherol, tocotrienol and BMI.
| |
|
Tocopherol |
Tocotrienol |
| Subject
|
n |
Alpha |
Beta |
Gamma |
Delta |
Total |
Alpha |
Gamma |
Delta |
Total |
| Caucasian
women |
14 |
-0.05 |
0.03 |
-0.14 |
0.37 |
-0.05 |
-0.11 |
-0.37 |
-0.07 |
-0.39 |
| Japanese
women |
20 |
0.13 |
0.15 |
0.22 |
-0.11 |
0.16 |
0.07 |
0.32 |
0.25 |
0.14 |
| Combined
|
34 |
0.06 |
0.07 |
-0.11 |
-0.14 |
0.03 |
-0.01 |
0.04 |
0.06 |
-0.11 |
No correlation was significant at P<0.05.
Table 6. Tocopherol and tocotrienol
in pre- and post-menopausal women's sera (llg/100 ml serum, mean± SEM).
| |
|
Pre-menopause |
Post-menopause |
P |
| Tocopherol |
Alpha |
1056.6± 66.5 |
1268.7± 85.3 |
0.059 |
| |
Beta |
18.6± 1.6 |
23.0± 1.7 |
0.07 |
| |
Gamma |
75.1± 10.7 |
89.6± 13.6 |
0.41 |
| |
Delta |
13.4± 1.7 |
20.9± 5.1 |
0.16 |
| |
Total |
1187.4± 75.5 |
1402.2± 80.6 |
0.06 |
| Tocotrienol |
Alpha |
28.6± 8.4 |
32.2± 11.4 |
0.80 |
| |
Gamma |
29.8± 8.7 |
22.5± 2.3 |
0.42 |
| |
Delta |
9.9± 1.4 |
11.5± 2.2 |
0.54 |
| |
Total |
68.2± 12.5 |
66.6± 13.9 |
0.93 |
References
- Duthie G G, Wahle W 1, lames W P T.
Oxidants, antioxidants and cardiovascular disease. Nut Res Rev 1989;
2: 51-62.
- Knekt P, Aromaa A, Maatela 1. Serum
vilamin E and risk of cancer among Finnish men during a 10-year
follow-up. Am vitamin 1988, }27: 28-34.
- Riemersma R A, Wood D A, Maclntyre
C C A, Elton R A, Gey K T and Oliver M F. Risk of angina pectoris
and plasma concentrations of vitamins A, C and E and carotene. Lancet
1991; 337: 1-5.
- Paul A A, Southgate D A, McCance and
Widdowson's. The composition of foods, 4th Ed. London: HMSO,1978,
41 -89.
- Machlin LJ. Handbook of vitamins.
2nd Ed. in 3 Vitamin E,1990; 99-143.

Copyright © 1992 [Asia Pacific Journal of Clinical
Nutrition]. All rights reserved.
Revised:
January 19, 1999
.
 to the top